
Figures & data
Figure 1. Map of Rwanda showing its five provinces (Northern, Southern, Eastern, Western, Kigali City), all of which were included in this survey of pond fish farming activities.
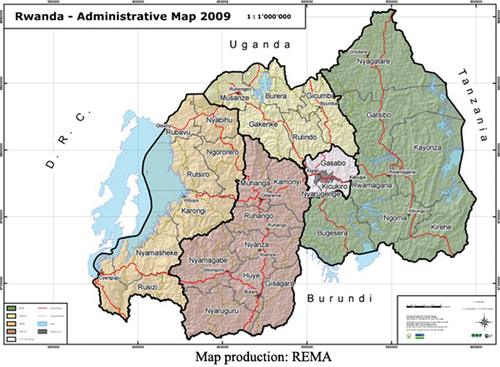
Table 1. General description of the survey respondents (N = 67) on fish farms in Rwanda.
Table 2. Total number of fish farms surveyed in Kigali City, Eastern, Southern, Western, and Northern province, Rwanda.
Table 3. Distribution of fish species cultured in different provinces of Rwanda (% of fish farms per province).
Table 4. Number, location and capacity of surveyed fish hatcheries in Rwanda.
Table 5. Tilapia stocking density applied in different provinces in Rwanda (% of farms per province).
Table 6. Fish-feeding strategy applied in different provinces in Rwanda (% of farms per province).
Table 7. Feed ingredients used by fish farmers and local fish feed producers in all five provinces of Rwanda. The ingredients are presented in descending order based on abundance for each category.
Table 8. Proximate composition and energy content of local feed ingredients (g kg−1 DM).