
Figures & data
Figure 1. Schematic overview of determinants and physiological indicators of stability stress.
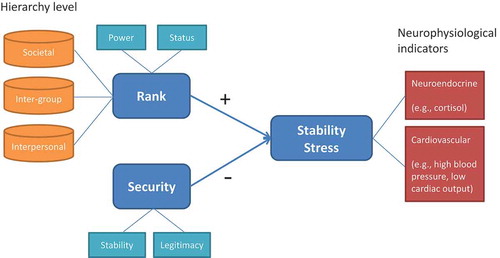
Figure 2. Threat – Challenge Index (TCI) as a function of power and power stability (Scheepers et al., Citation2015). The TCI is based on mean standardised reactivity scores (i.e., task-baseline scores) of cardiac output and total peripheral resistance (multiplied with −1). Lower scores indicate a stronger tendency towards threat and higher scores indicate a stronger tendency towards challenge.
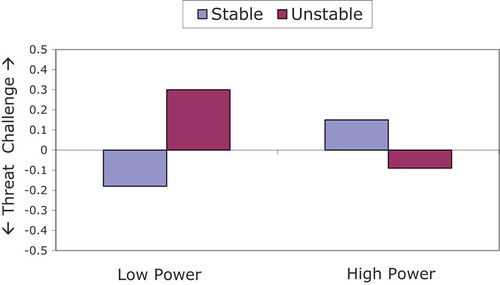
Figure 3. Mean Arterial Pressure (MAP, in mm Hg) as a function of group identification, group status and time of measurement (Scheepers & Ellemers, Citation2005).
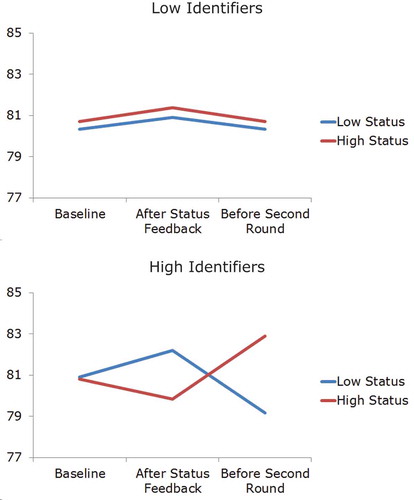
Figure 4. Threat – Challenge Index (TCI) as a function of status and status stability (Scheepers, Citation2009). The TCI is based on mean standardised reactivity scores (i.e., task-baseline scores) of cardiac output and total peripheral resistance (multiplied with −1). Lower scores indicate a stronger tendency towards threat and higher scores indicate a stronger tendency towards challenge.
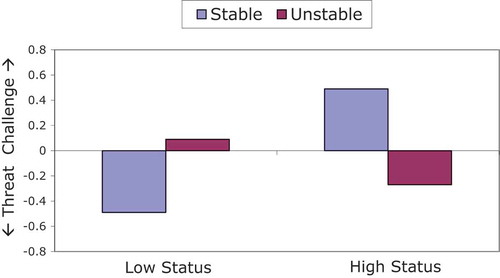
Figure 5. Threat – Challenge Index (TCI) as a function of group status and status legitimacy (Scheepers, Citation2017). The TCI is based on mean standardised reactivity scores (i.e., task-baseline scores) of cardiac output and total peripheral resistance (multiplied with −1). Lower scores indicate a stronger tendency towards threat and higher scores indicate a stronger tendency towards challenge.
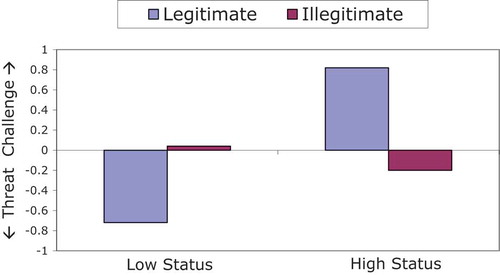
Figure 6. Systolic blood pressure (SBP, in mm Hg) reactivity (debate–baseline) as a function of condition, sex and debating topic (Scheepers, Ellemers, & Sintemaarstensdijk, Citation2009).
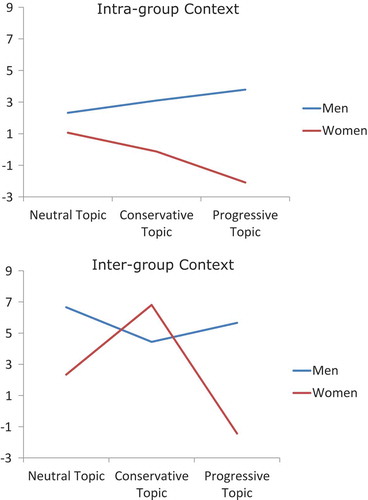
Figure 7. Modern sexism as a function of condition and sex. Modern sexism scores can range between 1 and 7.
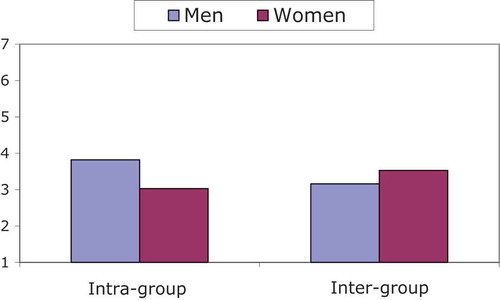
Table 1. Evidence for the stability-stress hypothesis among different types of species, hierarchies, and ranks.