Figures & data
Figure 1. A solar-powered TEOM monitors hourly PM10 concentrations at Mono Lake, CA.
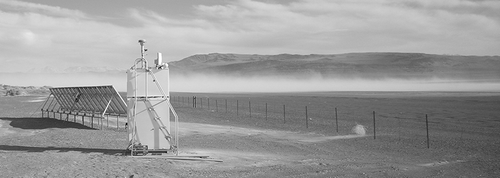
Figure 2. Process flow diagram for the Dust ID method.
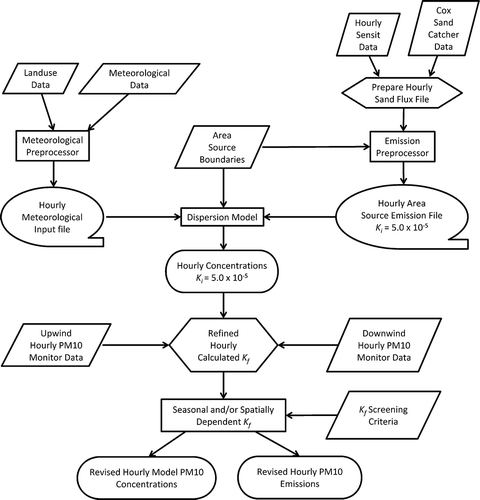
Figure 3. PM10, sand flux, and meteorological monitoring network.
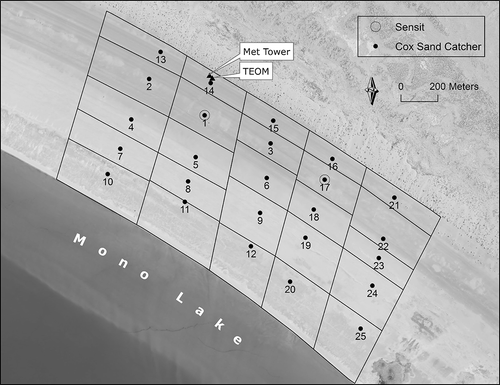
Figure 4. Diagram of a Cox sand catcher.
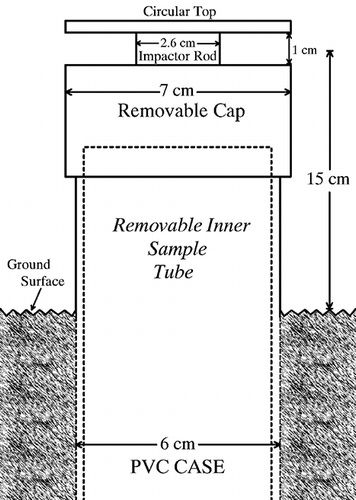
Figure 5. Sand flux site and dust monitoring equipment at Mono Lake, CA.
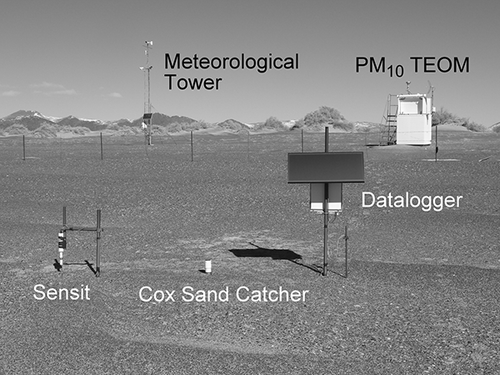
Figure 6. Daily average sand flux for the study period.
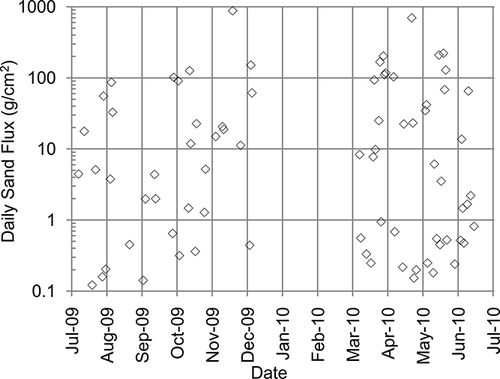
Figure 7. Daily average sand flux and downwind PM10 concentration.
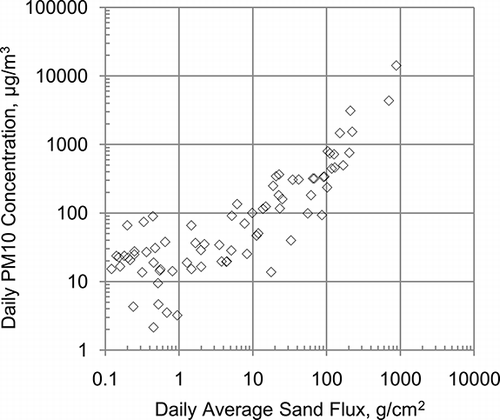
Figure 8. Hourly and seasonal K-factors for the study period.
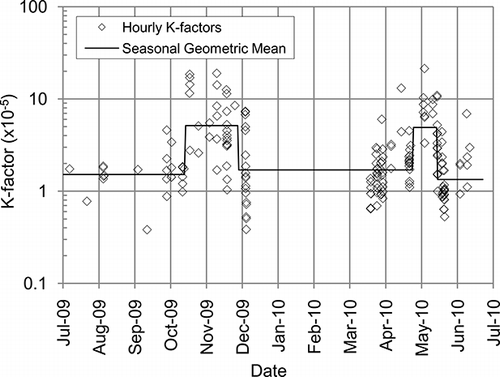
Figure 9. Hourly average PM10 emissions versus wind speed using the Dust ID method and the portable wind tunnel emissions algorithm.
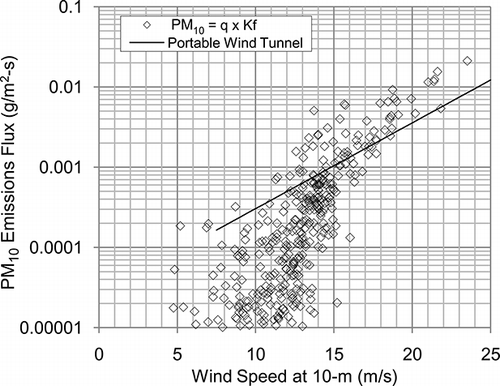
Table 1. Hourly model performance statistics July 2009 to June 2010
Figure 10. Hourly modeled versus monitored PM10 concentrations. Corresponding model performance statistics are shown in .

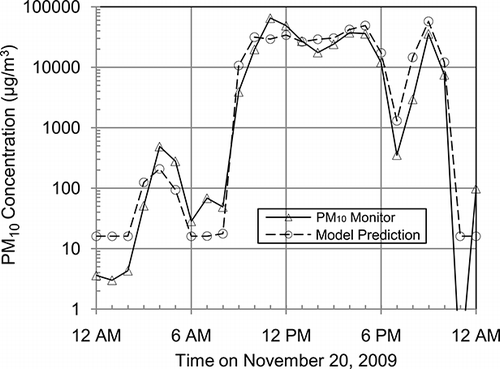
Figure 11. Comparison of hourly modeled and monitored PM10 concentrations for the November 20, 2009, dust event.