Figures & data
Figure 1. Air quality modeling domain to evaluate the impacts of distributed generation on ozone and PM in the San Joaquin Valley (SJV) of California. The SJV boundary is shown as a thick dotted line.
Figure 2. Model-predicted ozone: (a) peak 1-hr ozone, (b) peak 8-hr ozone, and (c) 24-hr PM concentrations, in the SJV using baseline emissions for the target year of the study (2023). Future emissions are developed based on the estimates from the air quality management plan developed by SJVAPCD to demonstrate the attainment of 8-hr ozone standard by the year 2023. Meteorological inputs are from CCOS and CRPAQS data sets for ozone and PM, respectively.
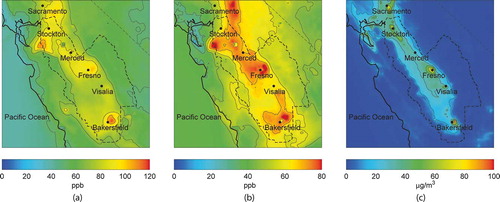
Table 1. Emission factors of all technologies and regulatory standards used in this study
Figure 3. Distribution of DG power by size class amongst the various land-use sectors considered in the SJVAB for the example scenario.
Figure 4. DG technology mix obtained using the DG scenario development framework for an example scenario.
Table 2. Basinwide emissions for all DG scenarios simulated in this study
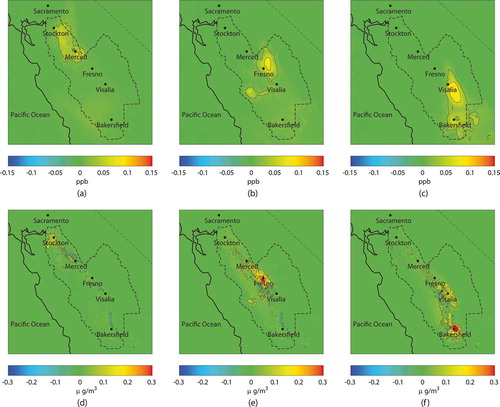
Figure 5. Effects of aggregate DG power. Increase in peak 1-hr ozone concentration due to emissions for scenarios (a) base DG scenario, (b) 45% of the increased demand, and (c) large-scale adoption. Increase in 24-hr average PM2.5 concentration due to emissions for scenarios (d) base DG scenario, (e) 45% of the increased demand, and (f) large-scale adoption.
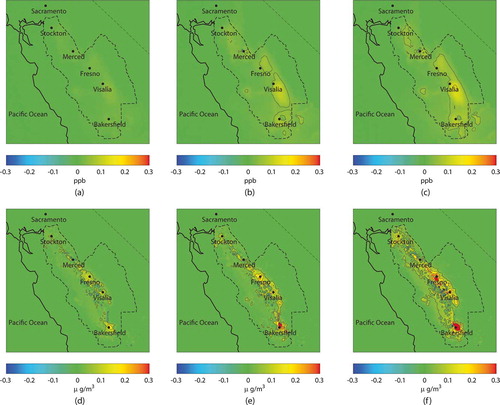
Figure 6. Air quality impacts of a central power plant: (a) increase in peak 1-hr ozone concentration due to emissions for scenarios; (b) increase in 24-hr average PM2.5 concentration.
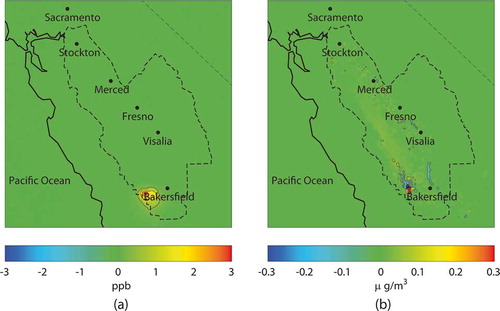
Figure 7. Effects of emissions specifications. Increase in peak 1-hr ozone concentration due to emissions for scenarios: (a) all DG at BACT standards and (b) out-of-compliance ICE. Increase in 24-hr average PM2.5 concentration due to emissions for scenarios: (c) all DG at BACT standards and (d) out-of-compliance ICE.
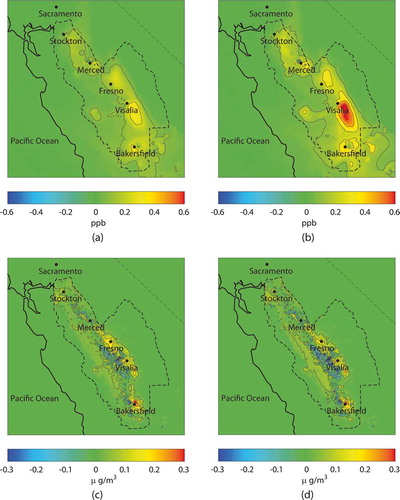
Figure 8. Effects of combined heating and power. Increase in peak 1-hr ozone concentration due to emissions for scenarios: (a) realistic CHP offset and (b) maximum CHP offset. Increase in 24-hr average PM2.5 concentration due to emissions for scenarios: (a) realistic CHP offset and (b) maximum CHP offset.
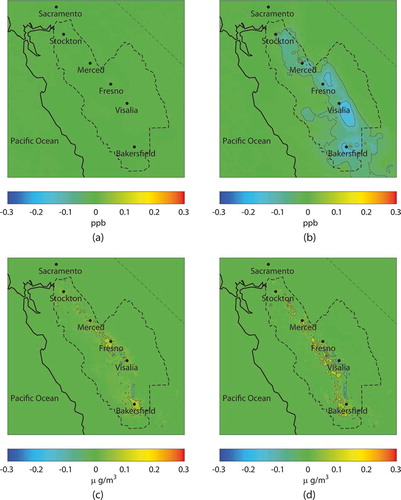
Figure 9. Spatial sensitivity of DG impacts. Increase in peak 1-hr ozone concentration due to emissions for scenarios: (a) sensitivity case with emissions located in the North section of the SJV, (b) sensitivity case with emissions located in the central section of the SJV, and (c) sensitivity case with emissions located in the South section of the SJV. Increase in 24-hr average PM2.5 concentration due to emissions for scenarios: (d) sensitivity case with emissions located in the north section of the SJV, (e) sensitivity case with emissions located in the central section of the SJV, and (f) sensitivity case with emissions located in the south section of the SJV.