Figures & data
Figure 1. Landscape and site locations of the atmospheric mercury sampling network surrounding the mercury-contaminated remediation site.
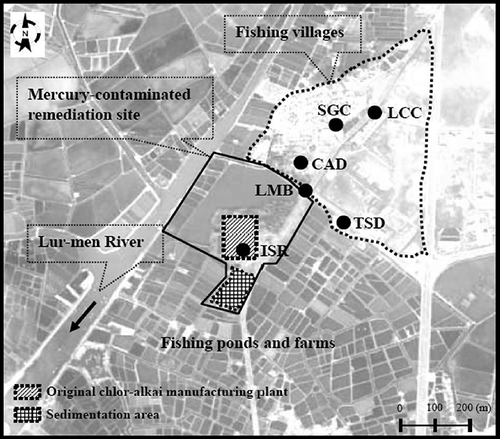
Figure 2. Schematic diagram of the separate atmospheric mercury sampling system for collecting GEM and PTM.
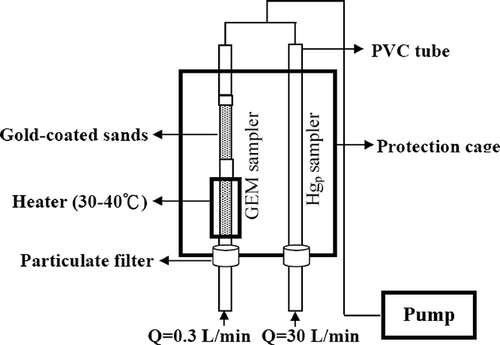
Table 1. Meteorological measurement data during the atmospheric mercury sampling periods
Table 2. Field measurement of atmospheric mercury concentrations and their mean, median, standard deviation (SD), and partition of GEM, PTM, and DFM at each sampling sites
Figure 3. Seasonal variation of GEM, PTM, and DFM at the mercury-contaminated remediation site.
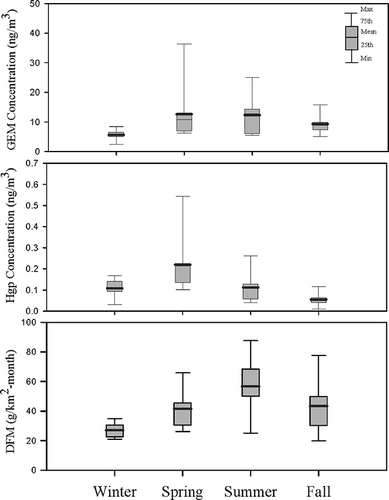
Table 3. Correlation of GEM, PTM, and DFM with ambient meteorological factors
Figure 4. Correlation of GEM concentration with ambient temperature and relative humidity.
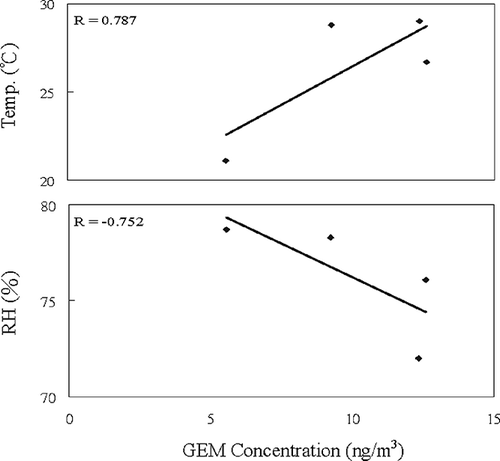
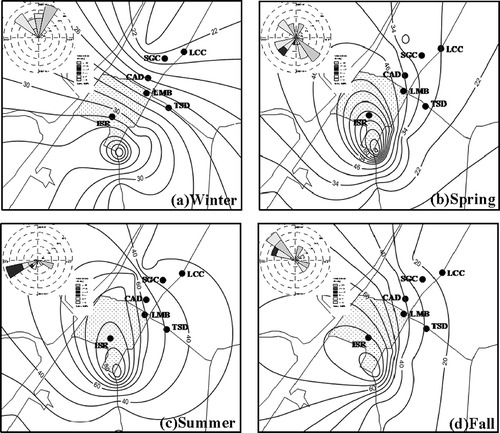
Figure 5. Concentration contour of GEM + PTM surrounding the mercury-contaminated remediation site.
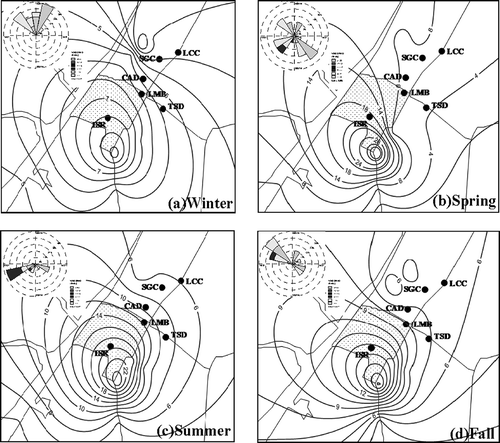
Figure 6. Concentration variation of GEM + PTM versus transportation distance from the southern tip of the mercury-contaminated remediation site to the downwind fishing villages.
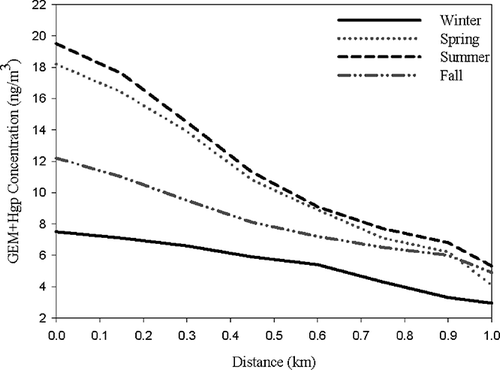
Figure 7. Comparison of auto-monitoring and manual sampling data during the open excavation period.
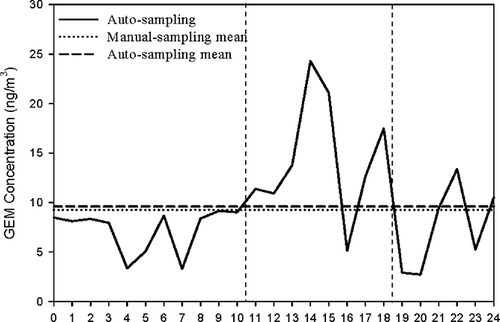
Figure 8. Spatial distribution of deposition fluxes of wet/dry mercury surrounding the mercury-contaminated remediation site.