Figures & data
Figure 1. (a) The topography, the domain system for MM5 model, and the location of Urumqi city. (b) Observational sites (Xinjiang Exhibition Centre, denoted as UR2), the Special Meteorological Station of Urumqi (denoted as UR1), the middle Tianshan Mountain pass (denoted as MT Pass) and the detailed topography of domain 3. The black dotted line is a cross-section along which simulated potential temperature and wind vectors are displayed in Figure 5d.
Table 1. The options description used for MM5 model simulation
Table 2. Daily average PM10 concentrations (μg m−3) and statistical results of the ESEG occurrence at 8:00 a.m. and 8:00 p.m. BST in Urumqi from 29 December 2008 to 14 January 2009
Table 3. Diurnal variation of inversion variables in Urumqi from 29 December 2008 to 14 January 2009
Figure 2. Average diurnal variation of (a) temperature, (b) relative humidity and daily evolution of (c) temperature, (d) relative humidity, and (e) wind vectors from 29 December 2008 to 14 January 2009 in Urumqi. Note that data on those days without asterisks at x-axis in (c) and (d) are interpolated because of lack of measurements. The area marked with pale blue in (e) denotes the ESEG in boundary layer.
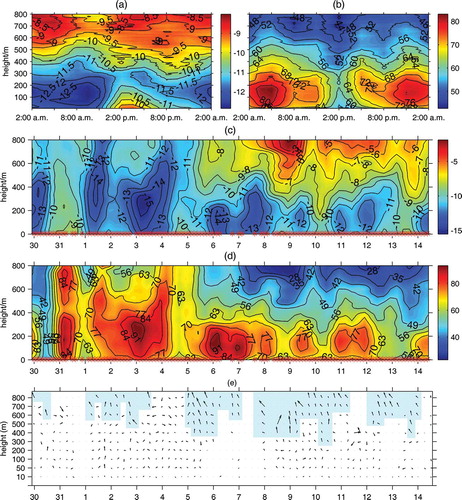
Figure 3. The profiles of (a) temperature, (b) relative humidity, (c) wind speed, and (d) wind direction using the tethered-sonde (TS, at the UR2 site) and the conventional radiosonde (CS, at the UR1 site) data at 8:00 a.m. BST on 5 and 8 January 2009. Surface weather maps at 8:00 a.m. BST on (e) 5 January and (f) 8 January. (The black dot in figures (e) and (f) is the location of Urumqi.)
Figure 4. Comparison of the simulated and observed evolution of (a) the wind speeds and (b) wind directions at level of ∼500 m during 4–13 January 2009. Comparison of (c1–c8) wind speed profiles and (d1–d8) wind direction profiles between the simulated and observed data at eight data-collection times on 8 January 2009 at the UR2 site of Urumqi. The legend in (a) is valid for (b); “TS Obs.” denotes the tethered-sonde observation at UR2; “CS Obs.” denotes the conventional radiosonde observation at UR1; “Mod.” denotes the simulated results at UR2 of Urumqi. The legend in (c) is valid for (d); “Obs.” denotes the tethered-sonde observation at UR2; “Mod.” is similar to the above.
Figure 5. Predicted near-surface winds over the middle Tianshan Mountain pass and Urumqi on 8 January 2009 (a) at 2:00 a.m. BST, (b) at 3:00 p.m. BST near the surface, and (c) at 3:00 p.m. BST at level of ∼500 m. Contours shows terrain height with intervals of 500 m. (d) Cross-sectional plot along the line (see and ) at 3:00 p.m. BST. Solid lines: potential temperature; vectors: wind component along cross-section, vertical wind component is increased by 10 times. The area in gray color in (d) represents terrain.