Figures & data
Figure 1. STN and IMPROVE PM2.5 chemical speciation sites in Minnesota. The STN sites are (1) Mille Lacs (ML), (2) Minneapolis—Phillips Neighborhood (MPN), (3) St. Paul—Harding High School (SPH), and (4) Rochester (ROC). The IMPROVE sites are (1) Voyageurs National Park (VOYA), (2) Boundary Waters Canoe Area (BOWA), (3) Blue Mounds State Park (BLMO), and (4) Great River Bluffs State Park (GRRI).
Table 1. Data Groupings for Unmix and PMF model inputs. Footnote*
Figure 2. Comparison of PMF geological factors with measured geological source profiles: (a) soil dust, (b) Ca-rich dust, and (c) taconite dust. Error bars in part c (not shown in parts a and b) represent the boot-strapping uncertainties for the Group I taconite factor calculated by PMF. See for modeling groups I–V. OCR and ECR indicate OC and EC measured by TOR, whereas OCT and ECT indicate OC and EC measured by TOT.
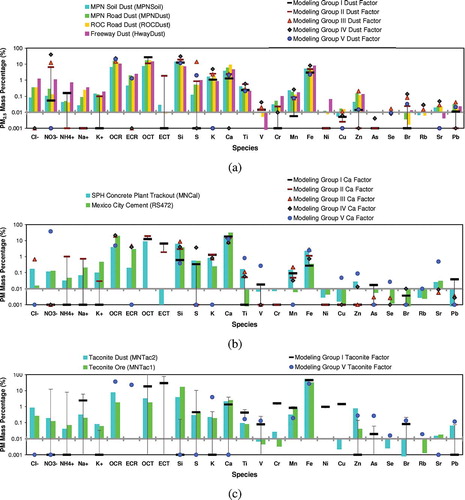
Figure 3. Comparison of PMF combustion factors with measured combustion source profiles: (a) gasoline vehicle, (b) diesel vehicle, and (c) biomass burning (BB). See for modeling groups I–V.
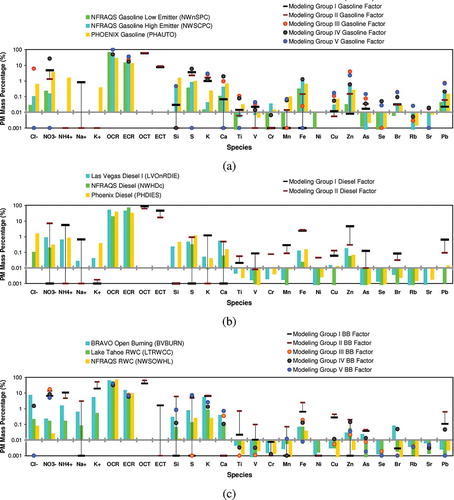
Table 2. SCEs (in μg/m3) by source type, site, and receptor model for STN sites after July 15, 2003 (modeling group I)
Table 3. SCEs (in μg/m3) by source type, site, and receptor model for STN sites before July 15, 2003 (modeling group II)
Table 4. SCEs (in μg/m3) by source type, site, and receptor model for IMPROVE sites (modeling groups V, III, and IV)
Table 5. FSCs (% of PM2.5) from this study compared with those from similar environments
Figure 4. Model-collective estimates (i.e., square and number: average; bar: median; box: 10th and 90th percentiles) of fractional source contributions (FSCs) for (a) STN sites after July 15, 2003; (b) STN sites prior to July 15, 2003; and (c) IMPROVE sites.
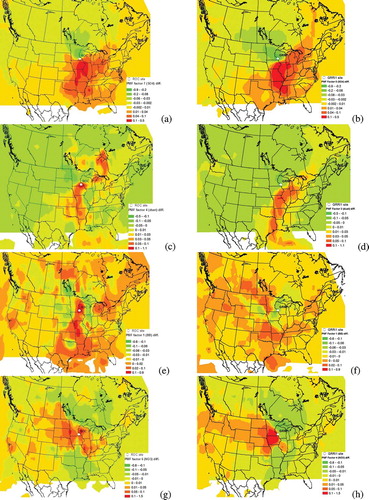
Figure 5. EBT probability maps for (a, b) secondary sulfate, (c, d) soil dust, (e, f) biomass burning, and (g, h) secondary nitrate factors resolved by PMF for the ROC and GRRI sites.