1,075
Views
11
CrossRef citations to date
0
Altmetric
Technical Papers

Concentrations and Diversity of Microbes from Four Local Bioaerosol Emission Sources in Finland

, , , , &
Pages 1382-1392 | Published online: 23 Nov 2011

Figures & data

Table 1. Median, minimum, and maximum concentrations of fungal and bacterial groups from different types of emission sources, determined with qPCR and expressed as cells/m3

Figure 1. Microbial concentrations within and in the vicinity of the waste centre as determined by qPCR analyses. The columns represent geometric mean concentrations and 95% confidence intervals of three measurements at each site. The sampling sites were next to the composting windrows, on the dumping ground and in the nearby population center. Notes: Clado = Cladosporium spp.; Cherb = Cladosporium herbarum; Cclad1 = Cladosporium cladosporioides; PenAsp = Penicillium/Aspergillus/Paecilomyces variotii; Afumi = Aspergillus fumigatus/Neosartorya fischeri; Anigr = Aspergillus niger/awamori/foetidus/phoenicis; Pbrev = Penicillium brevicompactum/stoloniferum; Pchry = Penicillium chrysogenum; Pvarb2 = Penicillium variabile; Apull = Aureobasidium pullulans; Eamst = Eurotium amstelodami/chevalieri/herbariorum/rubrum/repens; Enigr = Epicoccum nigrum; Wsebi = Wallemia sebi; Strepto = Streptomyces spp.

Figure 1. Microbial concentrations within and in the vicinity of the waste centre as determined by qPCR analyses. The columns represent geometric mean concentrations and 95% confidence intervals of three measurements at each site. The sampling sites were next to the composting windrows, on the dumping ground and in the nearby population center. Notes: Clado = Cladosporium spp.; Cherb = Cladosporium herbarum; Cclad1 = Cladosporium cladosporioides; PenAsp = Penicillium/Aspergillus/Paecilomyces variotii; Afumi = Aspergillus fumigatus/Neosartorya fischeri; Anigr = Aspergillus niger/awamori/foetidus/phoenicis; Pbrev = Penicillium brevicompactum/stoloniferum; Pchry = Penicillium chrysogenum; Pvarb2 = Penicillium variabile; Apull = Aureobasidium pullulans; Eamst = Eurotium amstelodami/chevalieri/herbariorum/rubrum/repens; Enigr = Epicoccum nigrum; Wsebi = Wallemia sebi; Strepto = Streptomyces spp.

Figure 2. Total concentration of viable bacteria and fungi in three sampling points downwind from the emission source. The columns represent the geometric mean of 2–10 measurements with an Andersen six-stage impactor. Sampling point 1 (black column) is next to the emission source and 2 and 3 as increasing distances. In the waste center area, sampling point 1 is in next to the composting windrows, sampling point 2 in perimeter of the dumping ground, and sampling point 3 in a population center. *P < 0.05; **P < 0.01.
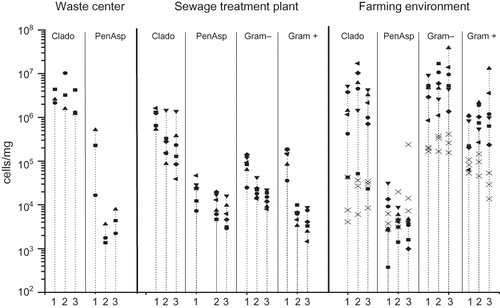
Figure 2. Total concentration of viable bacteria and fungi in three sampling points downwind from the emission source. The columns represent the geometric mean of 2–10 measurements with an Andersen six-stage impactor. Sampling point 1 (black column) is next to the emission source and 2 and 3 as increasing distances. In the waste center area, sampling point 1 is in next to the composting windrows, sampling point 2 in perimeter of the dumping ground, and sampling point 3 in a population center. *P < 0.05; **P < 0.01.

Figure 3. Microbial concentrations in the sewage treatment plant area and in the nearby population center determined with qPCR. Geometric mean concentrations and 95% confidence intervals of 6 samples at each site are presented. For qPCR assay abbreviations, see *P < 0.05; **P < 0.01.
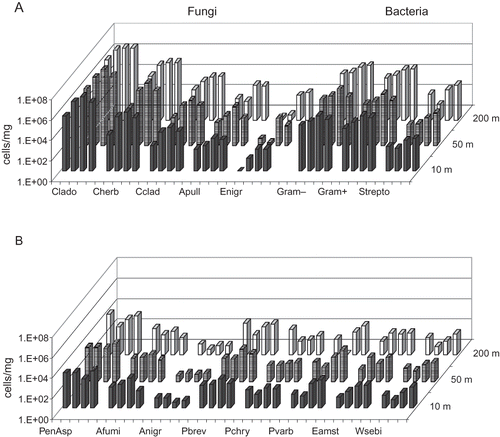
Figure 3. Microbial concentrations in the sewage treatment plant area and in the nearby population center determined with qPCR. Geometric mean concentrations and 95% confidence intervals of 6 samples at each site are presented. For qPCR assay abbreviations, see Figure 1. *P < 0.05; **P < 0.01.

Figure 4. Geometric mean concentrations and 95% confidence intervals of fungal species/groups, Gram-positive and -negative bacteria and the bacterium Streptomyces spp. in the farming environment next to the cowshed and in two locations at different distances on the prevailing downwinds from the cowshed, determined with qPCR (n = 6 at each site in June and n = 3 at each site in November). J = June; N = November. For qPCR assay abbreviations, see *P < 0.05; **P < 0.01.
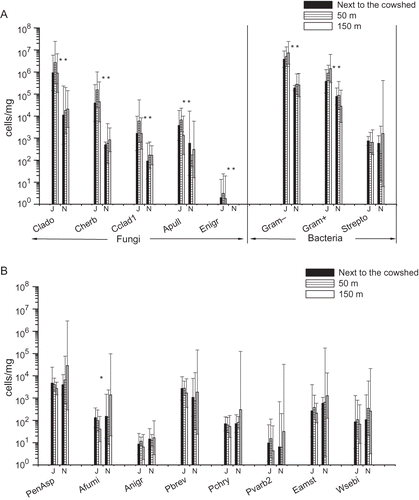
Figure 4. Geometric mean concentrations and 95% confidence intervals of fungal species/groups, Gram-positive and -negative bacteria and the bacterium Streptomyces spp. in the farming environment next to the cowshed and in two locations at different distances on the prevailing downwinds from the cowshed, determined with qPCR (n = 6 at each site in June and n = 3 at each site in November). J = June; N = November. For qPCR assay abbreviations, see Figure 1. *P < 0.05; **P < 0.01.

Figure 5. Concentrations of fungi and bacteria before, during, and 1–5 days after cattle manure spreading in three prevailing downwind distances from the spreading area, determined with qPCR. The four columns in a group represent the four sampling times; from left to right: before, 0–1 days after, 1–3 days after, and 3–5 days after manure spreading. For qPCR assay abbreviations, see
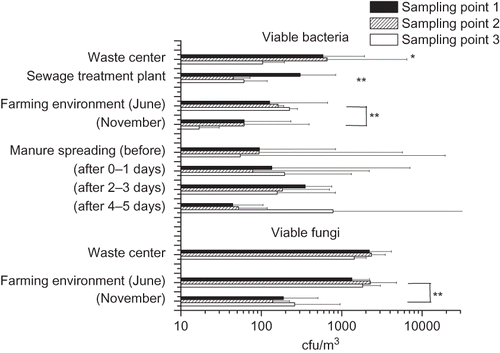
Figure 5. Concentrations of fungi and bacteria before, during, and 1–5 days after cattle manure spreading in three prevailing downwind distances from the spreading area, determined with qPCR. The four columns in a group represent the four sampling times; from left to right: before, 0–1 days after, 1–3 days after, and 3–5 days after manure spreading. For qPCR assay abbreviations, see Figure 1.

Figure 6. Daily variation in the concentrations of Cladosporium spp. (Clado), Penicillium/Aspergillus/P. variotii group (PenAsp), and Gram-positive and -negative bacteria measured with qPCR. Different symbols in the vertical lines illustrate the concentrations measured on each individual day. The numbers (1–3) in the x-axis represent the three distances from the emission source. In the farming environment, the concentrations measured in November are marked with a cross (×).
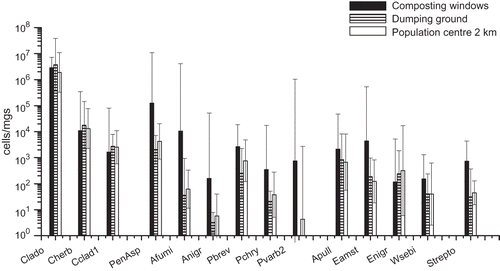
Figure 6. Daily variation in the concentrations of Cladosporium spp. (Clado), Penicillium/Aspergillus/P. variotii group (PenAsp), and Gram-positive and -negative bacteria measured with qPCR. Different symbols in the vertical lines illustrate the concentrations measured on each individual day. The numbers (1–3) in the x-axis represent the three distances from the emission source. In the farming environment, the concentrations measured in November are marked with a cross (×).

Reprints and Corporate Permissions

Please note: Selecting permissions does not provide access to the full text of the article, please see our help page How do I view content?

To request a reprint or corporate permissions for this article, please click on the relevant link below:

Academic Permissions

Please note: Selecting permissions does not provide access to the full text of the article, please see our help page How do I view content?

Obtain permissions instantly via Rightslink by clicking on the button below:

If you are unable to obtain permissions via Rightslink, please complete and submit this Permissions form. For more information, please visit our Permissions help page.