Figures & data
Figure 1. Schematic diagram of the experimental installation. 1 = N2; 2 = O2; 3 = 10% NO/N2; 4 = 1.25% SO2/N2; 5 = 10% NH3/N2; 6 = rotor flowmeters; 7 = mass flowmeters; 8 = thermometers; 9 = temperature controllers; 10 = wash bottle (water); 11 = mix bottle; 12 = ammonia trap bottle (phosphoric acid); 13 = stainless steel tubular reactor; 14 = tube furnace; 15 = 42C-HL NO-NO2-NOx analyzer; 16 = 43C-HL SO2 analyzer.
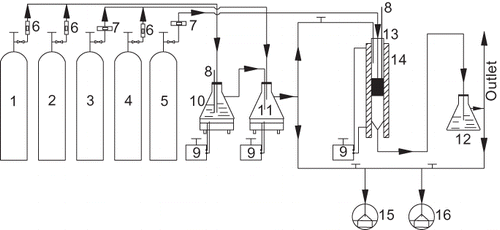
Table 1. Standard reaction conditions for catalyst activity measurement
Table 2. BET results of Mn/TiO2 and Mn-Ce/TiO2 with different precursors
Figure 2. XRD patterns of Mn/TiO2 and Mn-Ce/TiO2 with different precursors.
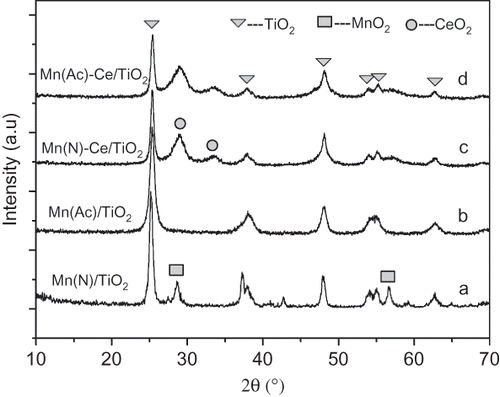
Figure 3. Spectra of Mn 2p binding energy of Mn/TiO2 and Mn-Ce/TiO2 catalysts derived from different precursors.
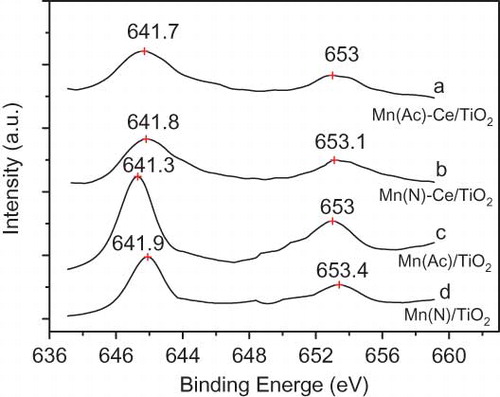
Figure 4. Spectra of Ce 3d binding energy of Mn(Ac)-Ce/TiO2 and Mn(N)-Ce/TiO2.
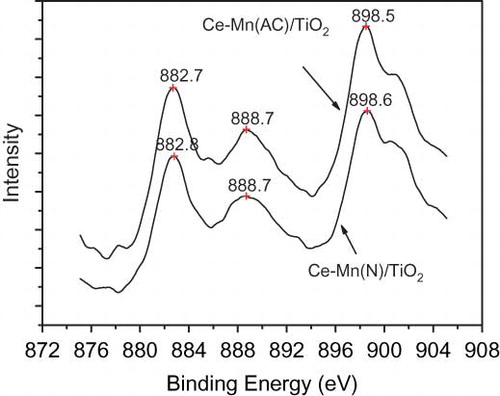
Table 3. XPS results of the catalysts
Figure 5. H2-TPR patterns of Mn/TiO2 and Mn-Ce/TiO2 catalysts from different precursors.
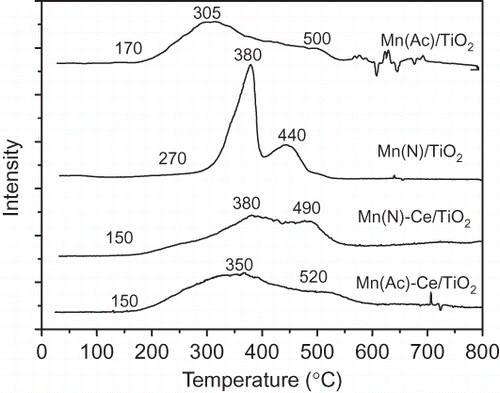
Figure 6. NO conversion over Mn/TiO2 and Mn-Ce/TiO2 catalysts from different precursors. NO = 1000 ppm, NH3 = 1100 ppm, O2 = 6%, GHSV = 5000 hr−1, balance N2.
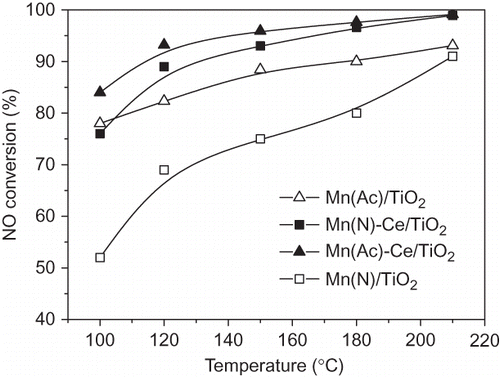
Figure 7. The impact of the introduction of SO2/H2O for 2 hr on Mn/TiO2 and Mn-Ce/TiO2 catalysts from different precursors. NO = 1000 ppm, NH3 = 1100 ppm, O2 = 6 %, GHSV = 5000 hr−1, SO2 = 200 ppm, H2O = 10% (if used), balance N2, T = 150 °C.
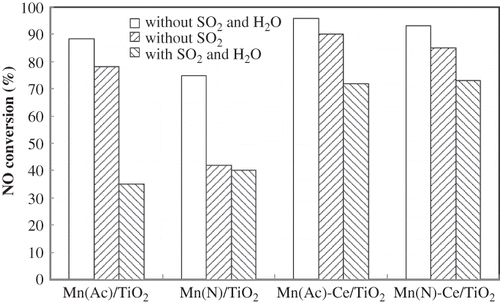
Figure 8. The effect of SO2 and H2O for extended times on Mn-Ce/TiO2 catalysts. NO = 1000 ppm, NH3 = 1100 ppm, O2 = 6 %, GHSV = 5000 hr−1, SO2 = 200 ppm, H2O = 10 %, balance N2, T = 170 °C.
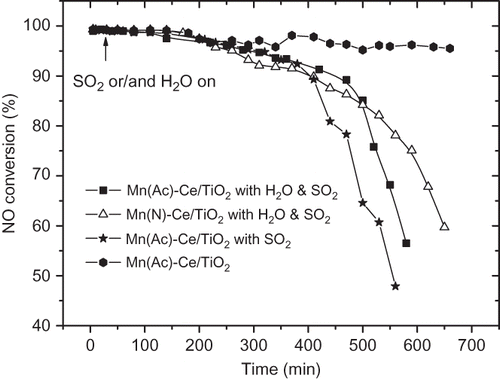
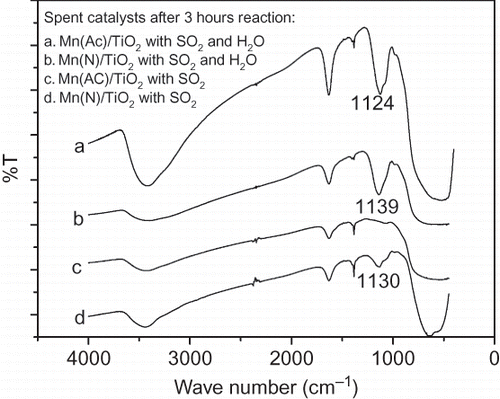
Figure 9. FT-IR spectra of spent Mn/TiO2 from different precursors under the influence of SO2 and H2O.