Figures & data
Table 1. Description of feedlots KS1 and KS2
Figure 1. Schematic diagram showing locations of PM10 samplers and weather stations at feedlots (a) KS1 and (b) KS2.
Figure 2. Wind speed and wind direction distributions at the feedlots for the 2-yr period: (a) KS1 May to November; (b) KS1 December to April; (c) KS2 May to November; (d) KS2 December to April.
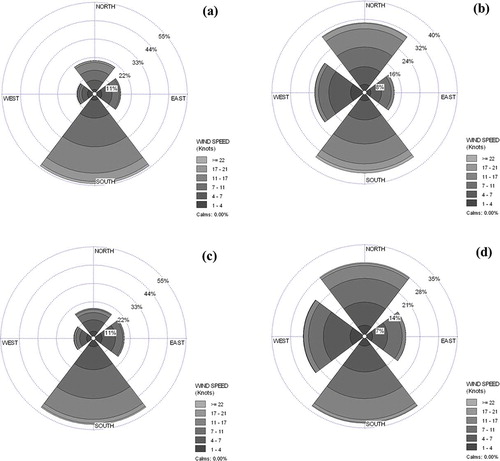
Table 2. Median PM10 concentrations at feedlot KS1 and KS2 for 2007 and 2008
Figure 3. Median hourly net PM10 concentrations for feedlots (a) KS1 and (b) KS2. Median values were based on days with emission data. Error bars represent upper standard deviation estimates.
Table 3. PM10 emission fluxes and factors at feedlots KS1 and KS2
Figure 4. Monthly trends of emission flux plotted with temperature at feedlots (a) KS1 and (b) KS2; with amount of rain at (c) KS1 and (d) KS2; and with amount of sprinkler water at (e) KS1.
Figure 5. Median hourly PM10 emission fluxes at feedlots (a) KS1 and (b) KS2. Median values were based on days with emission data. Error bars represent upper standard deviation estimates.
Figure 6. Percentage contribution of each hour to the daily PM10 emission flux for feedlots KS1 and KS2 based on mean hourly PM10 emission fluxes for the 2-yr period using days with emission data.