Figures & data
Figure 1. “Google Books N-gram Viewer” of the English corpus for the terms “social resilience, community resilience, organizational resilience, organizational resilience” (Case-Insensitive with Smoothing of 1) in the period from 1970 to 2019.
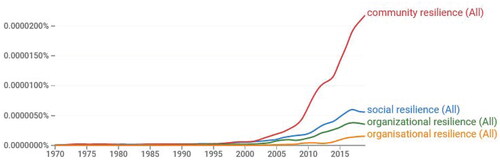
Figure 2. “Google Books N-gram Viewer” of the German corpus for the term “soziale Resilienz” (Case-Insensitive with Smoothing of 1) in the period from 1970 to 2019.
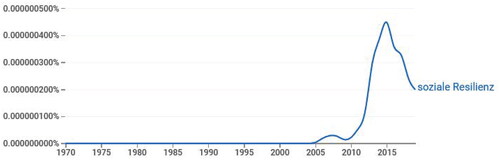
Figure 3. Development of an idealized infrastructure system’s quality when a crisis occurs at time
and the pre-crisis level is fully restored by time
(Bruneau et al., Citation2003, p. 737). The area shaded-in (by Fröh/Robinson) corresponds to the loss of resilience.
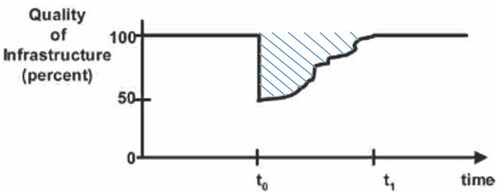
Figure 4. McAllister’s resilience model depicting two different trajectories of an infrastructure system’s functionality over the course of a crisis (McAllister, Citation2016, p. 2).
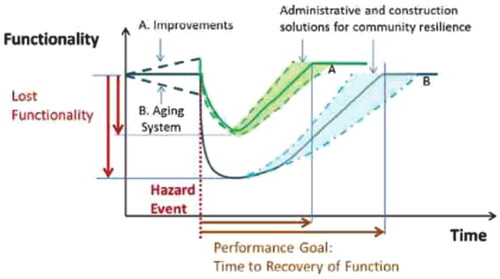
Figure 5. Development of a social system’s quality with the four necessary conditions resulting from the overlapping natural- and social-scientific perspectives on resilience identified in the literature.
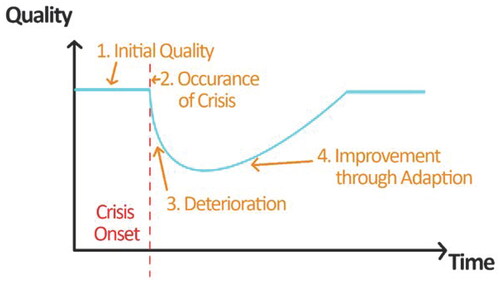
Figure 6. Two developments, A and B, of a social system’s quality from the occurrence of a crisis until shortly after the further development of this crisis or until shortly after the occurrence of a related crisis.
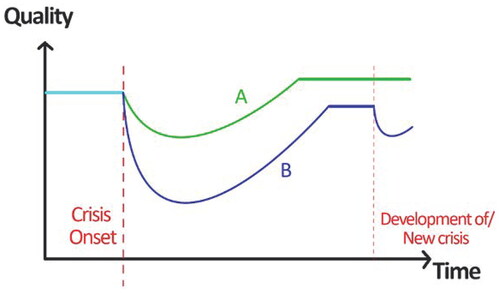
Figure 7. Illustration of the three social-scientific development lines “stability“, “recovery time” and “future security” based on two developments of a system’s quality .
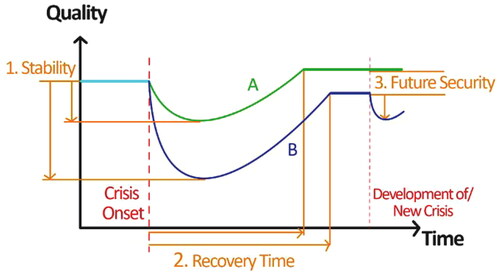
Figure 8. Plot of the resilience integrals’ areas according to Bruneau et al. based on two developments of a system’s quality (green filled: A; blue dotted: B).

Figure 9. Combined model of social resilience of the developments A and B, with the areas of the resilience integrals marked (green filled: A; blue dotted: B).
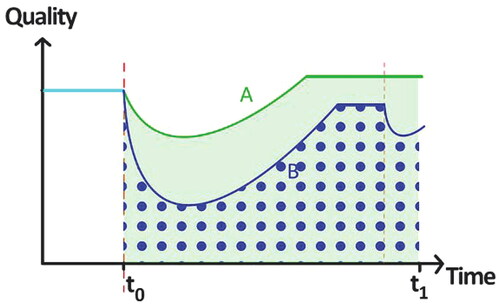
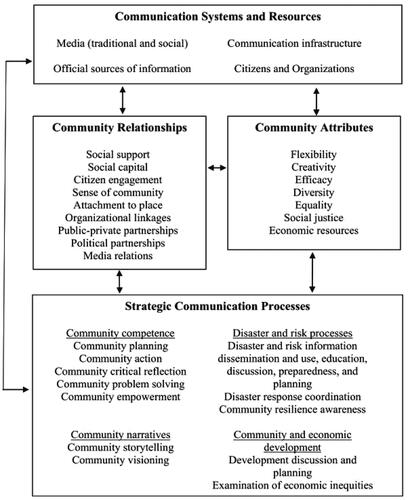
Figure 10. Communication-centered resilience framework from Houston et al (Houston, Spialek et al., Citation2015, p. 274).