Figures & data
Figure 1. Simulated CIPP and daily close. (A) Simulated price process; (B) Returns based on daily close; (C) Histogram of returns from daily close; (D) ACF of squared returns from daily close.
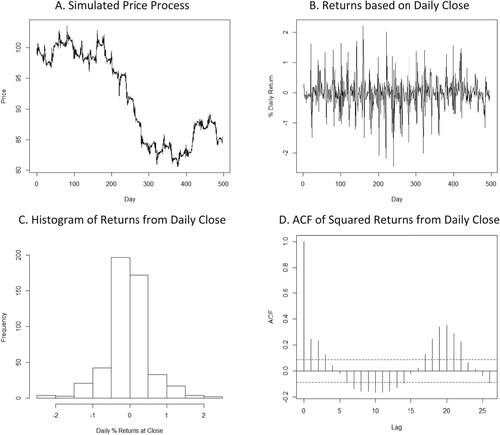
Figure 2. Covariance functions. (A) Spectral covariance function τ = 2 and γ = 1; (B) B-spline covariance function τ = 2 and 13 knots.
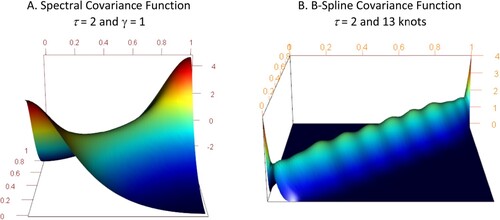
Table 1. Estimated parametric components for duration models. All of the coefficients are significant at 0.05 according to the Bayesian p-valueTable Footnotea except Tuesday and Wednesday for CITI in the mixture model. TST are time sensitive trades. TIT are time insensitive trades.
Figure 3. Price process for PG. (A) Prices for 2011-04-01; (B) Average number of arrivals per 15 min; (C) Return histogram all trades; (D) Return histogram 30 min sampling; (E) ACF of return squared all trades; (F) ACF of returned squared 30 min sampling.
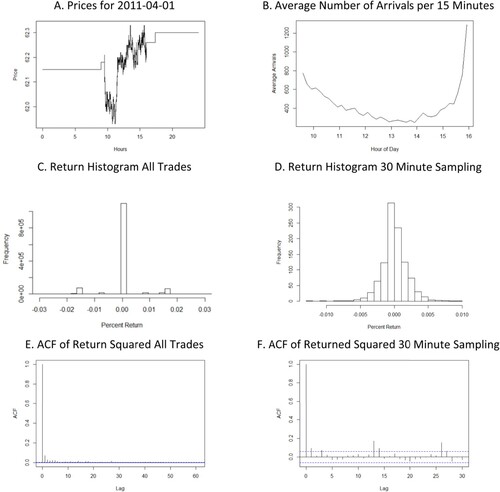
Figure 4. Cosine series and B-spline for duration model of UGI. (A) 30 term cosine series of lagged percent return. (B) 30 term cosine series of time of day. (C) B-splines with knots at 1 percentile points (35 internal knots) and customised (12 internal knots) for lagged per cent return. (D) B-splines with knots at 1% points (99 internal knots) and 12 min intervals (32 internal knots) for time of day.
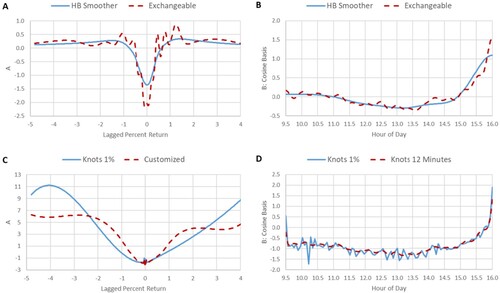
Figure 5. Nonparametric estimates of lagged return in duration intensity function. Posterior means and 2.5 and 97.5 posterior percentiles.
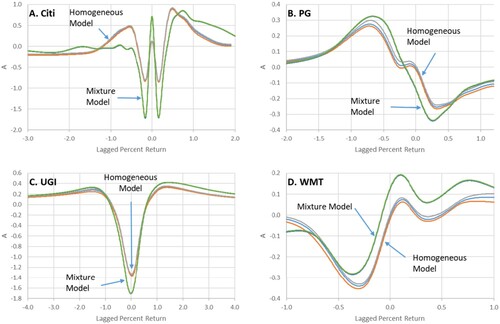
Figure 6. Nonparametric estimates of time of day in duration intensity function. Posterior means and 2.5 and 97.5 posterior percentiles.
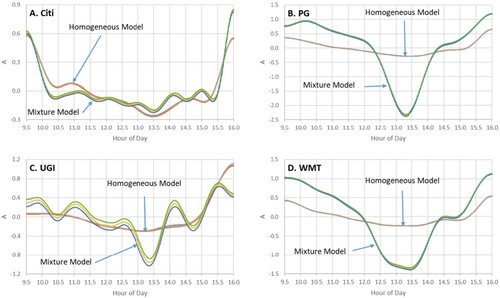
Figure 7. Return distributions. Posterior means and 2.5% and 97.5% percentiles.
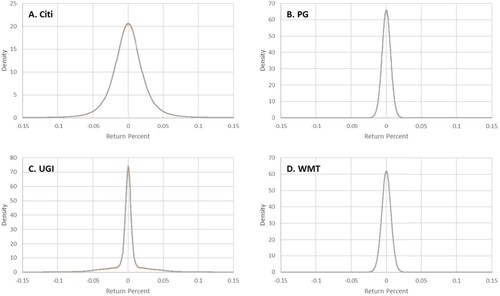
Table 2. Estimated off-hour trading models.
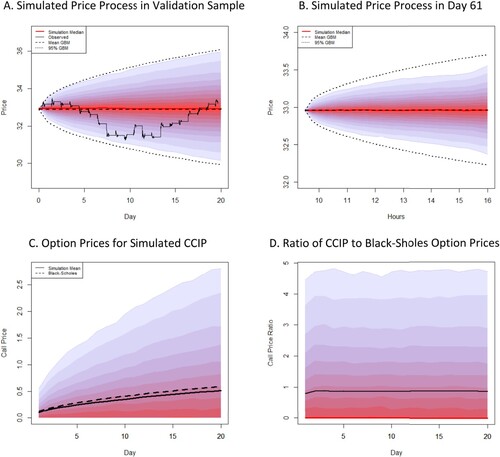
Figure 8. Simulated CIPP in validation sample and option prices for UGI. The colour bands are intervals that contain 5% of the simulated values from 5% to 95%. The outmost limits are 2.5% and 97.5%. (A) Simulated price process in validation sample; (B) Simulated price process in day 61; (C) Option prices for simulated CCIP; (D) Ratio of CCIP to black-sholes option prices.