
Figures & data
Table 1. Contents of the SRT-EP.
Table 2. Distribution of items by blocks in the SRT-EP.
Table 3. GLMMs in Sets A and B: overview of the dependent variables (DVs) and predictors.
Table 4. Reliability statistics for both scoring methods.
Figure 1. Overall performance (i.e., accuracy rate) on the SRT per scoring measure and group (the red dots and lines represent the mean and the standard error from the mean, respectively).
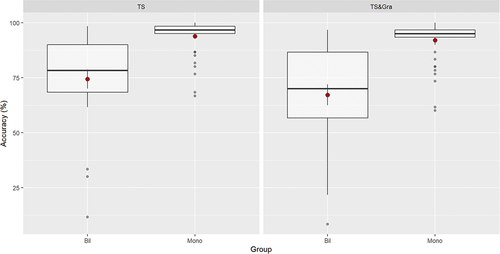
Figure 2. Performance (i.e., accuracy rate) on the SRT per level of complexity, scoring measure and group (the red dots and lines represent the mean and the standard error from the mean, respectively).
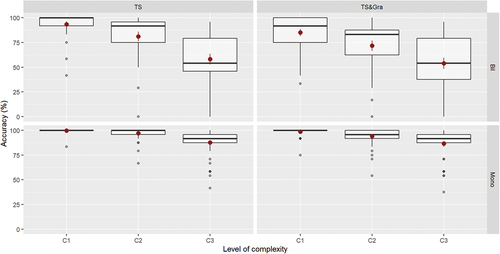
Table 5. Performance (i.e., accuracy rate) on the SRT structures per scoring measure and group.
Table 6. Summary of the GLMM for the measure TS (Subset A1).a
Table 7. Summary of the GLMMs for the measure TS&Gra (Subset A1).a
Figure 3. Measure TS: predicted probabilities of an accurate answer plotted by age, group and level of complexity.
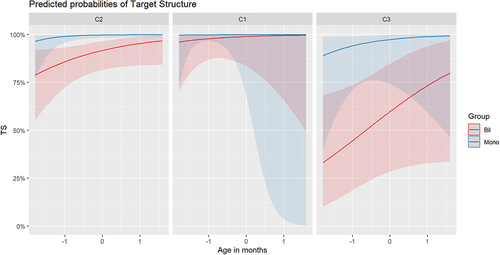
Figure 4. Measure TS&Gra: predicted probabilities of an accurate answer plotted by age, group and level of complexity.
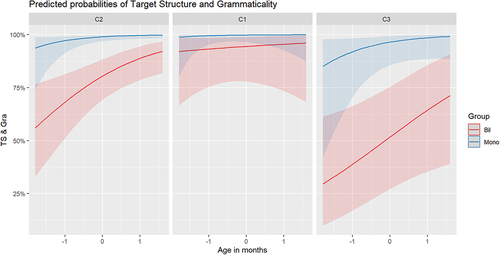
Table 8. Summary of the GLMMs for the measure TS (Subset A2).a
Table 9. Summary of the GLMMs for the measure TS&Gra (Subset A2).a
Table 10. Summary of the GLMMs for the measure TS (Set B).a
Table 11. Summary of the GLMM for the measure TS&Gra (Set B).a
Figure 5. Measure TS (Set B): predicted probabilities of an accurate answer plotted by age, richness of the HL input (HL.RICHNESS) and level of complexity.
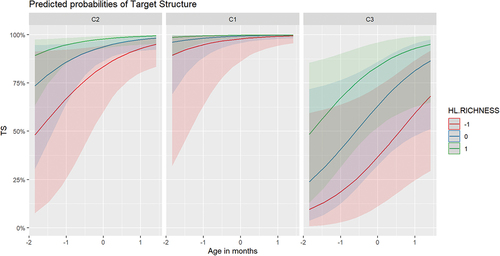
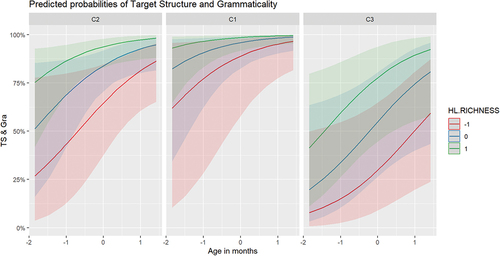
Figure 6. Measure TS&Gra (Set B): predicted probabilities of an accurate answer plotted by age, richness of the HL input (HL.RICHNESS) and level of complexity.
Supplemental Material
Download MS Word (35.3 KB)Data Availability Statement
Due to the nature of this research, participants of this study did not agree for their data to be shared publicly.