Figures & data
Figure 1. Images of the current physical door simulator.
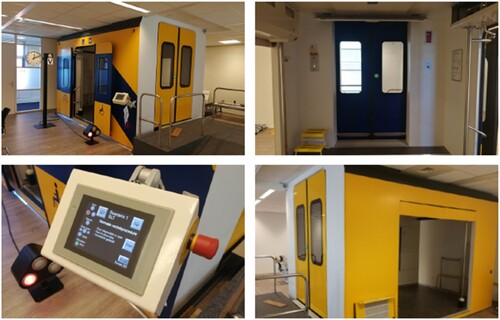
Figure 2. Adaptive learning boundaries embed in the “flow channel” (adapted from Göbel and Wendel (Citation2016) and Paramythis and Loidl-reisinger (Citation2004)).
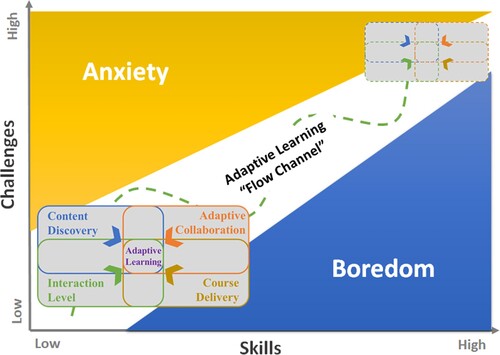
Figure 3. Followed design process adapted from Peffers et al. (Citation2007) with numbers indicating respective sections and subsections of the paper.
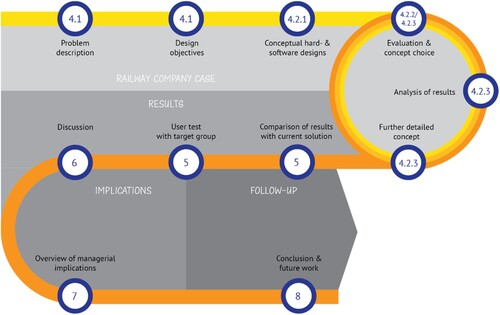
Table 1. Group characteristics.
Table 2. Solution objectives and requirements.
Figure 4. Holistic overview of the design and development process.
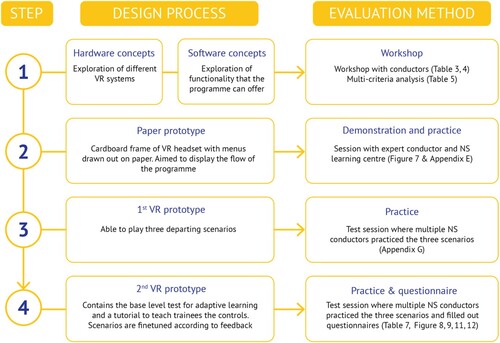
Table 3. Results of the conductor workshop on the hardware concepts.
Table 4. Results of the conductor workshop on the software concepts.
Table 5. Results of the multi-criteria analysis.
Figure 5. Activity block diagram of the application.
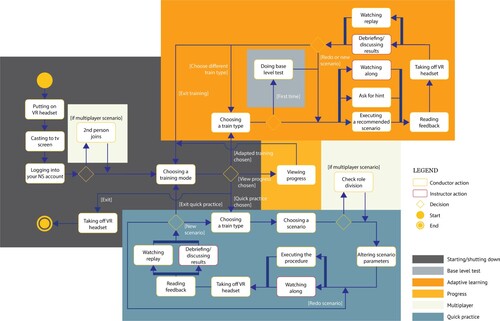
Figure 6. Functional block diagram of the application.
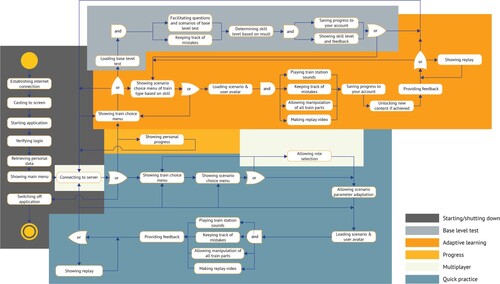
Figure 7. Paper prototype.
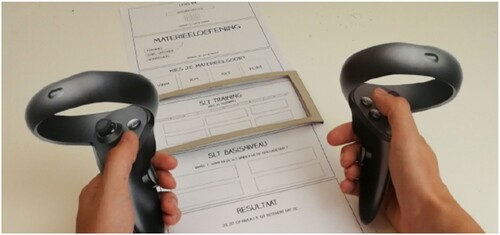
Table 6. Detailed functionality of the VR training system.
Figure 8. Design logic of the adaptive base level test.
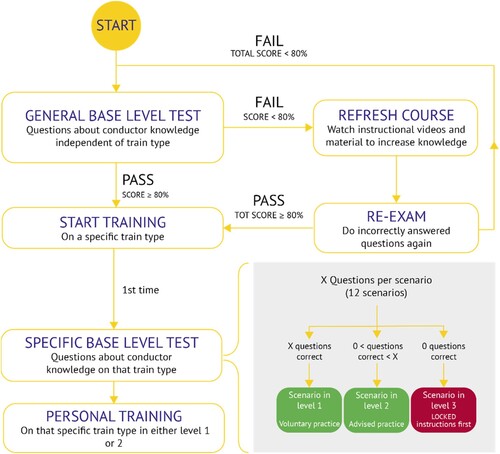
Figure 9. Screenshots of the final version of the prototype.
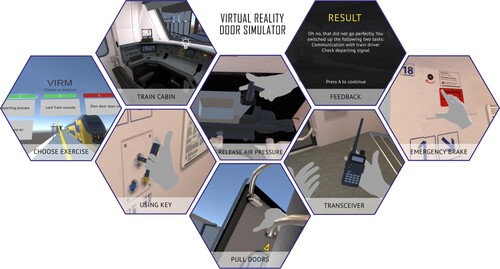
Figure 10. Schedule for evaluation sessions.
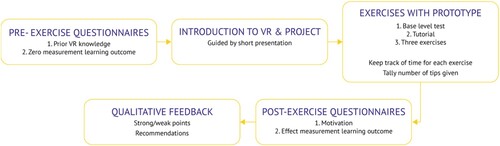
Table 7. The average time needed, and the average number of tips asked per exercise by the 10 participants, with one standard deviation.
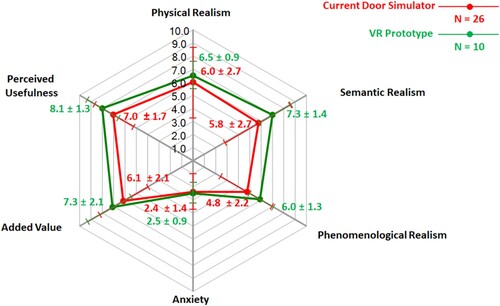
Figure 11. Evaluation of the educational impact of both solutions.
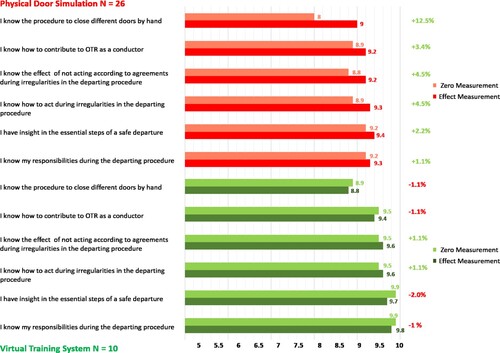
Figure 12. Overall learning preference of the conductors with both solutions.