Figures & data
Table 1. Condensed theoretical framework (left) and its operationalization (right) to facilitate design for learning in immersive virtual learning environments.
Figure 1. Structure of virtual environment inside the CAVE: side and bird’s-eye view (top left, top right), scoreboard, lever to verify answers, model of whole brain (bottom left), individual brain areas (bottom right). Colored dots indicate areas where connections can be drawn between different elements.
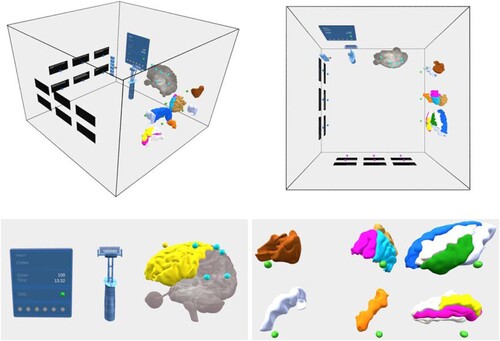
Figure 2. Examples of implemented strategies to foster learning. Intuitive interaction: using 3D mouse to highlight areas of interest (top left), provide answer by drawing connection (top right), pull lever to verify answer (middle left). Feedback on right/wrong answers (middle right), collaborative learning (bottom left), turn taking instruction to foster active participation (bottom right).
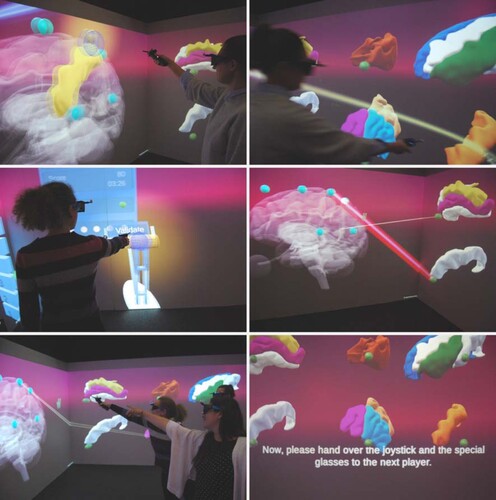
Table 2. Examples of the technical implementation of the recommendations into the collaborative virtual learning environment.
Figure 3. Dynamic logging model. The model shows how incoming data streams on learner actions (indicated with circles in the figure) with the virtual environment and body-related information are logged, making the information available for in-depth analysis, and is automatically processed by a replay module and a behavior encoder, respectively outputting: (1) a visual replay of learner behavior; (2) an analysis overview of individual and collaborative behavior types of choice.
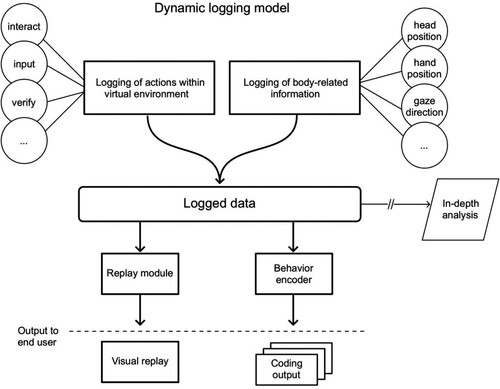
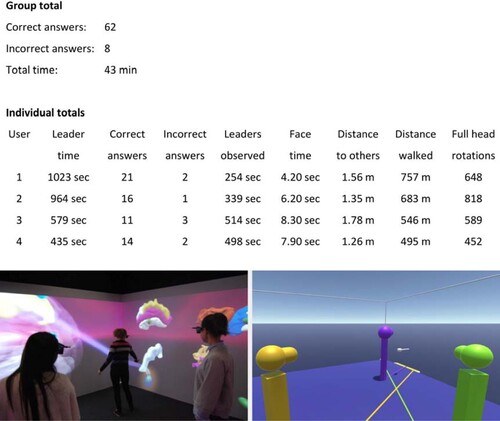
Figure 4. Implementation of the model. Top: Example results of automated (behavioral) analysis, showing group statistics as well as individual performance metrics. The metrics are explained in the section preceding this figure. Bottom: Actual scene inside CAVE (left) and corresponding visual replay, with colored lines indicating gaze direction of the learners (right).