Abstract
Rumen development is critical for the development of early lambs. This work aims to evaluate the effects of abrupt weaning at day 21 on rumen fermentation, histomorphological traits and the ruminal microbiota compared with continuous suckling. Twelve pairs of artificially reared full-sib neonatal male Hu lambs were allocated to two groups, one of which was weaned at day 21 (EW group) and the other which was not weaned (CON group). At day 26 and day 49, six lambs from each group were randomly selected and sacrificed to collect ruminal contents and rumen tissue samples. Results showed that weaning influenced the fermentation parameters in the rumen, and altered the microbial community composition on day 49 (p < 0.05). Several genera were associated with rumen fermentation parameters (p < 0.05). Volatile fatty acid (VFA) concentration is the key parameter impacting microbiota composition. Weaning influenced the expression of genes associated with VFA metabolism and regulation of cell proliferation (p < 0.05). In conclusion, weaning significantly influenced the morphological and functional development of the rumen, and bacterial community composition. The microbial community composition was strongly associated with rumen weight and fermentation profiles, but not with morphological development.
Keywords:
Disclosure statement
The authors declare that the research was conducted in the absence of any commercial or financial relationships that could be construed as a potential conflict of interest.
Figure 1. Alpha diversity index of rumen bacteria in different groups. (A) ACE; (B) Chao1; (C) Shannon, and; (D) Simpson. C26: control group, sampled at day 26; EW26: weaning group, sampled at day 26; C49: control group, sampled at day 49; EW49: weaning group, sampled at day 49.
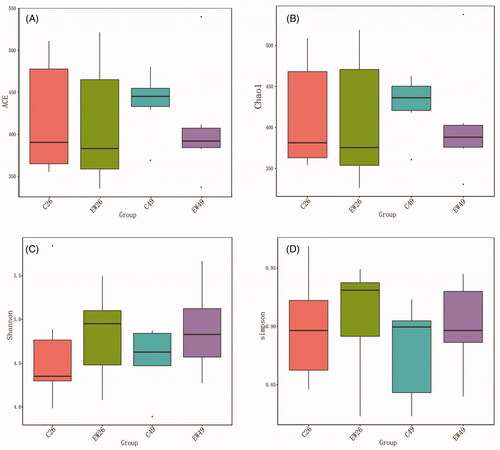
Figure 2. Taxonomic profiles of the top 10 phyla in different groups. CON26: control group, sampled at day 26; EW26: weaning group, sampled at day 26; CON49: control group, sampled at day 49; EW49: weaning group, sampled at day 49.
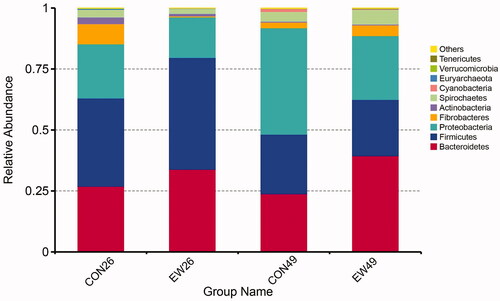
Figure 3. Heat map of the genus-level taxonomic composition. The values on the heat map are z-scores, which are the standardized relative abundances of ruminal genera. The z-score is a dimensionless quantity obtained by subtracting the population mean from an individual raw score and then dividing the difference by the population standard deviation. CON26: control group, sampled at day 26; EW26: weaning group, sampled at day 26; CON49: control group, sampled at day 49; EW49: weaning group, sampled at day 49.
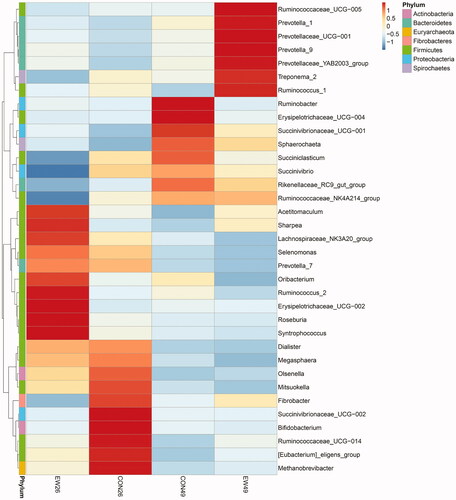
Figure 4. Results of linear discriminant analysis (LDA) effect size (LEfSe) on the ruminal microbiota. (A) Histogram of the LDA scores computed for biomarker discovery among different groups. The clades with a LDA score >4 were identified as statistically and biologically differential, and explain the greatest proportion of the differences among different communities. (B) Representation of relevent features on taxonomic trees. The most statistically and biologically different bacterial clades are colored differently. CON26: control group, sampled at day 26; EW26: weaning group, sampled at day 26; CON49: control group, sampled at day 49; EW49: weaning group, sampled at day 49.
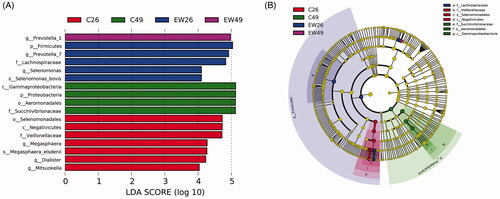
Figure 5. Principal coordinate analysis (PCoA) of the ruminal bacterial OTUs (A) and weighted Unifrac in different groups (B). CON26: control group, sampled at day 26; EW26: weaning group, sampled at day 26; CON49: control group, sampled at day 49; EW49: weaning group, sampled at day 49. **p < 0.01, *p < 0.05.
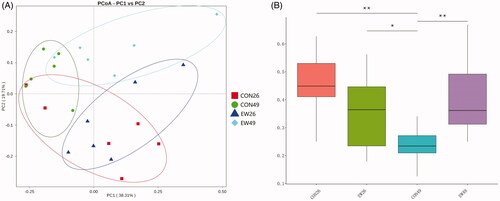
Figure 6. Analysis of similarities (ANOSIM) of the bacterial community composition between groups. CON26: control group, sampled at day 26; EW26: weaning group, sampled at day 26; CON49: control group, sampled at day 49; EW49: weaning group, sampled at day 49.
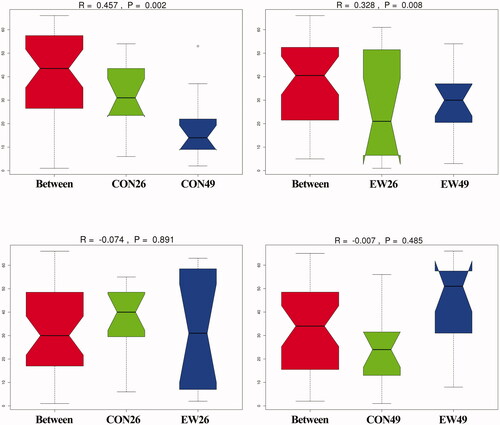
Figure 7. Correlation coefficients among relative abundances of ruminal bacterial genera (top 35 most abundant genus) and rumen metabolic and morphological traits. TVFA: total VFAs; AA: acetate; PA: propionate; BA: butyrate; VA: valerate; IsoBA: isobutyrate; IsoVA: isovalerate; TN: total nitrogen; AN: ammonia nitrogen; UN: urea nitrogen; PN: protein nitrogen; WR: rumen weight; PHR: papilla height of rumen; PWR: papilla base width of rumen; MTR: muscular thickness of rumen. **p < 0.01, *p < 0.05.
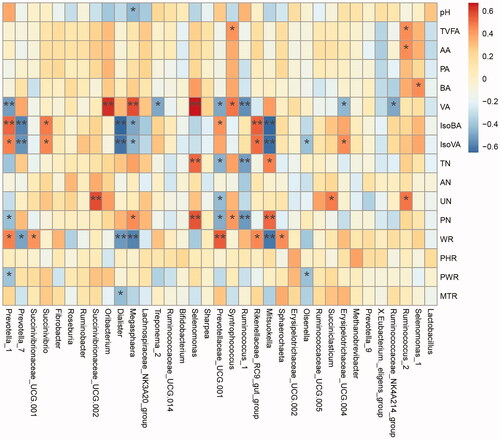
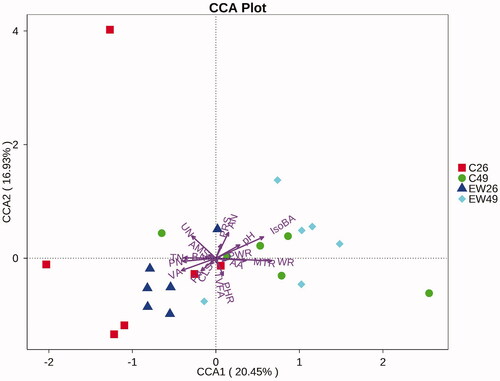
Figure 8. Canonical correspondence analysis (CCA). Ruminal ecology variables data and OTU abundances were used to generate the CCA. TVFA: total VFAs ; AA: acetate; PA: propionate; BA: butyrate; VA: valerate; IsoBA: isobutyrate; IsoVA: isovalerate; TN: total nitrogen; AN: ammonia nitrogen; UN: urea nitrogen; PN: protein nitrogen; WR: rumen weight; PHR: papilla height of rumen; PWR: papilla base width of rumen; MTR: muscular thickness of rumen.