
Figures & data
Figure 1. Differentially expressed genes and transcripts of yak during pregnancy and postpartum anestrus. Note: DEG: Differentially expressed genes; DET: differentially expressed transcripts; upregulated: number of upregulated transcripts or gene; downregulated: downregulate the number of transcripts or gene.
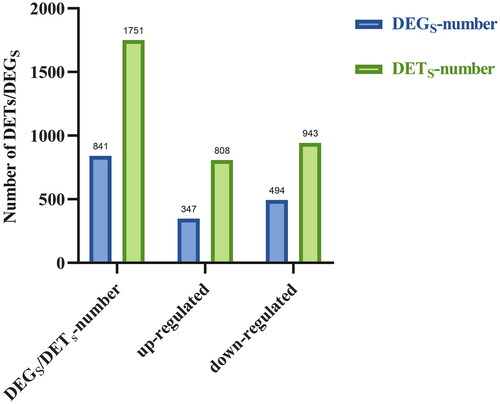
Figure 2. Pie chart of AS event types in pregnant and postpartum anestrus yaks. (A) Pie charts of AS event types of yak pregnancy genes. (B) Pie charts of AS event types of yak postpartum anestrus genes. A3: Variable transcoding termination site; A5: variable transcription start site; SE: exon jumping; RI: intron retention; MEE: variable exons.
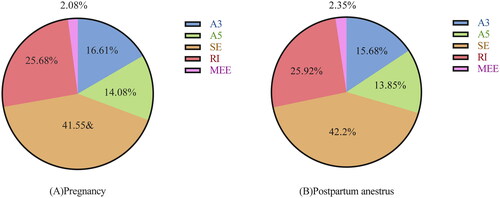
Figure 3. Distribution of APA loci in genes in pregnant and postpartum anestrus yaks. Note: abscissa: Number of polyadenylation sites; vertical axis: number of genes. (A) Numerical distribution of APA loci of the yak pregnancy gene. (B) Numerical distribution of APA loci of the yak postpartum anestrus gene.
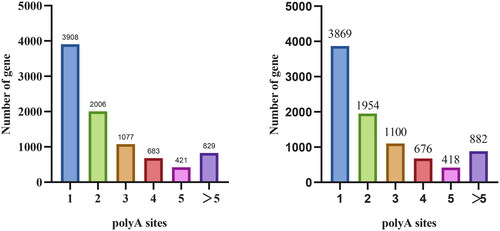
Figure 4. GO annotation classification. Statistical chart of DETs in pregnant and postpartum anestrus yaks. Note: The abscissa is the GO category, the left side of the ordinate is the percentage of transcripts, and the right side is the number of transcripts. This map shows the enrichment of transcripts of each secondary function of GO under the background of DETs and all transcripts, reflecting the status of each secondary function under the two backgrounds. The secondary function with a significant proportion of differences indicates that the enrichment trend of DETs is different from that of all transcripts, and can focus on whether this function is related to differences.
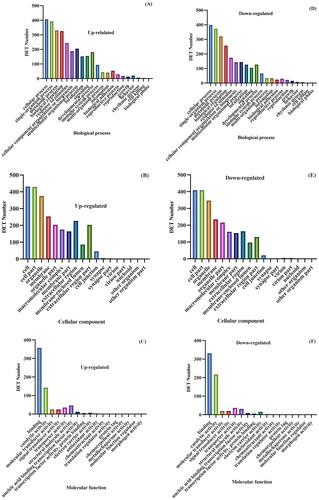
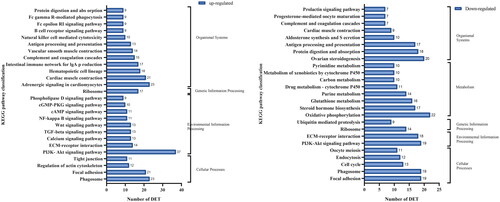
Figure 5. KEGG annotation and enrichment of DETs in pregnant and postpartum anestrus yaks. Note: The ordinate is the name of the KEGG metabolic pathway, and the abscissa is the number of transcripts annotated to the pathway.
Supplemental Material
Download MS Word (58.6 KB)Supplemental Material
Download MS Word (43.3 KB)Supplemental Material
Download MS Word (57 KB)Supplemental Material
Download MS Word (64.9 KB)Supplemental Material
Download MS Word (477 KB)Supplemental Material
Download MS Word (527 KB)Data availability statement
The data that supports the findings of this study are available in the supplementary material of this article.