
Figures & data
Table 1. Composition and nutrient levels of basal diets (air-dry basis).
Figure 1. Effects of JCGLPP on the slaughter performance of Minxinan black rabbits. (a) Adjusted p values were calculated using Dunnett’s multiple comparisons test (*p < 0.05, **p < 0.01, ***p < 0.001); (b) the p values of slope deviation from zero are both less than 0.01.
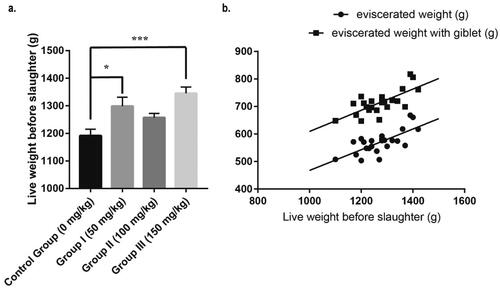
Table 2. Effects of JCGLPP on the carcass weight of Minxinan black rabbits.
Table 3. Effect of JCGLPP on cecal fermentation of Minxinan black rabbits.
Table 4. Effect of JCGLPP on occludin of Minxinan black rabbits(ng·mL−1).
Figure 2. (a). the OTU Venn diagram of microflora in the cecum of Minxinan black rabbits; (b) the bar chart of microflora in the cecum of Minxinan black rabbits. Note: A = Control(0 mg·kg−1), B=(50 mg·kg−1), C=(100 mg·kg−1), D=(150 mg·kg−1), the same below.
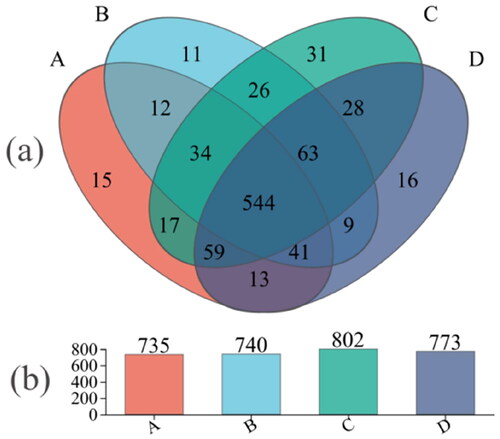
Figure 3. Dilution curve of cecum microorganism sequencing in Minxinan black rabbits. Note: A = Control (0 mg·kg−1), B = Group I (50 mg·kg−1), C = Group II (100 mg·kg−1), D = Group III (150 mg·kg−1).
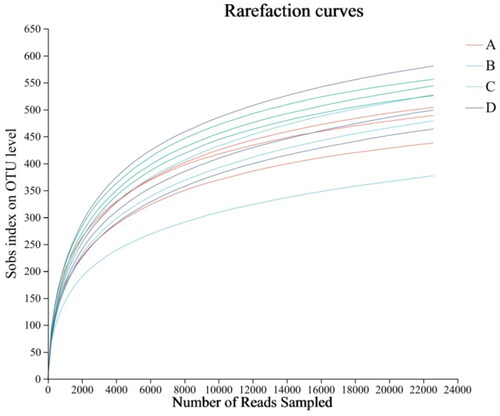
Table 5. Effect of JCGLPP on cecal microbial Alpha diversity of Minxinan black rabbits.
Figure 4. Beta diversity analysis of microflora in the cecum of Minxinan black rabbits. (a) PCoA of rumen microbial composition based on weighted Unifrac; (b) PCoA of rumen microbial composition based on Unweighted Unifrac. Note: A = Control (0 mg·kg−1), B = Group I (50 mg·kg−1), C = Group II (100 mg·kg−1), D = Group III (150 mg·kg−1).
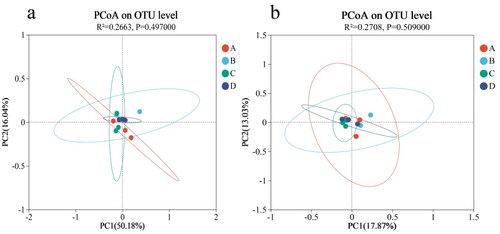
Figure 5. (a) Relative abundance of OTUs about the cecal microflora of Minxinan black rabbits on phylum level; (b) relative abundance of OTUs about the cecal microflora of Minxinan black rabbits on genus level. Note: A = Control (0 mg·kg−1), B = Group I (50 mg·kg−1), C = Group II (100 mg·kg−1), D = Group III (150 mg·kg−1).
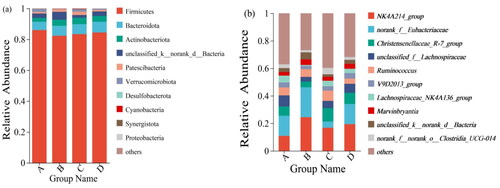
Table 6. Relative abundance of microorganisms at phylum level (%).
Table 7. Relative abundance of microorganisms at genus level (%).
Figure 6. LDA value distribution of cecal microflora in Minxinan black rabbits. Note: A = Control (0 mg·kg−1), B = Group I (50 mg·kg−1), C = Group II (100 mg·kg−1), D = Group III (150 mg·kg−1).
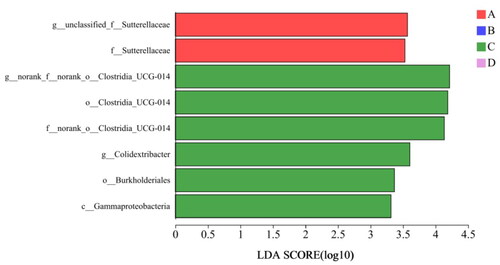
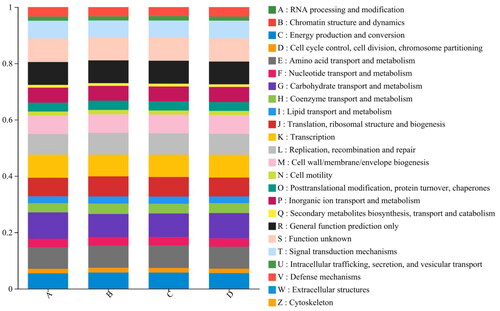
Figure 7. Functional classification bar chart of cecal microflora in Minxinan black rabbits. Note: A = Control (0 mg·kg−1), B = (50 mg·kg−1), C = (100 mg·kg−1), D = (150 mg·kg−1).
Supplemental Material
Download MS Word (12.5 KB)Data availability statement
The data that support the findings of this study are available from the corresponding author, [Q.H.L.], upon reasonable request.