
Figures & data
Table 1. The specific primers used for qPCR.
Table 2. Quality control of small RNA sequencing data.
Figure 1. Length distribution of small RNAs in DF (A) and SF (B) granulosa cells.
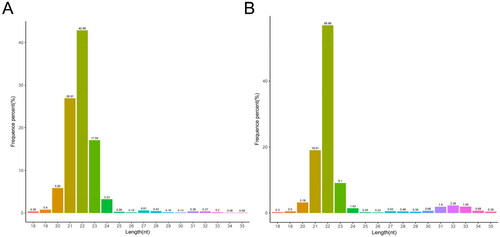
Figure 2. Annotation classification of small RNAs in DF (A) and SF (B) granulosa cells.
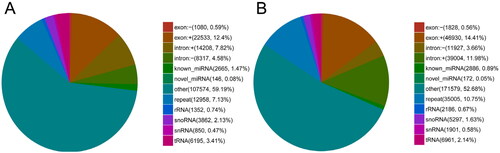
Figure 3. Volcano map and hierarchical clustering analysis showing the expression profiles of miRNAs in DF and SF granulosa cells. (A) Volcano map shows the miRNAs expression with corrected P < 0.05 and |log2(fold change)| ≥ 1. Red dots represent the upregulated miRNAs, while blue dots represent the downregulated miRNAs. (B) The heatmap shows the significantly expressed miRNAs with corrected P < 0.05 and |log2(fold change)| ≥ 1.
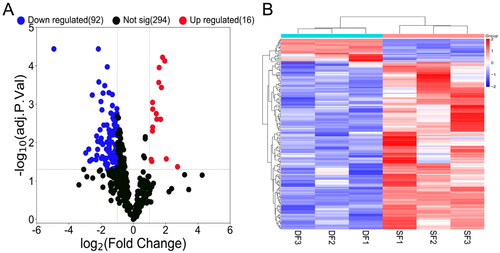
Figure 4. GO enrichment analysis of target genes of differentially expressed miRNAs. Gene count indicates the number of inputs of target genes of differentially expressed miRNAs annotated to the category.
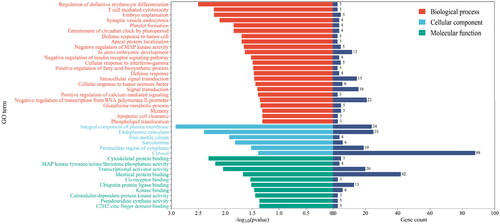
Figure 5. KEGG enrichment analysis of target genes of differentially expressed miRNAs. The size of each dot represents the number of target genes of differentially expressed miRNAs enriched in the corresponding pathway. A pathway with a corrected P value <0.05 is significantly overrepresented.
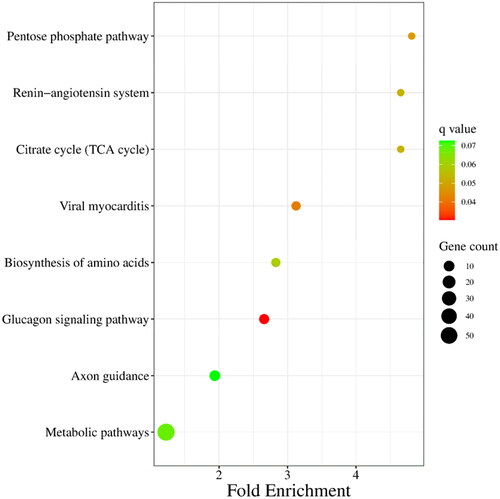
Figure 6. Potentially functional miRNAs and their predicted targeted genes compose this interactive network. The red triangle and green circles represent miRNAs and their targeted genes, respectively. The straight lines indicate the interaction.
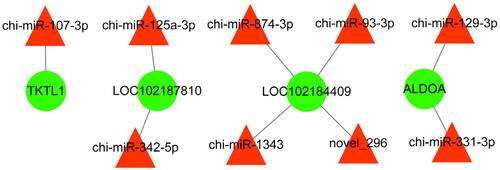
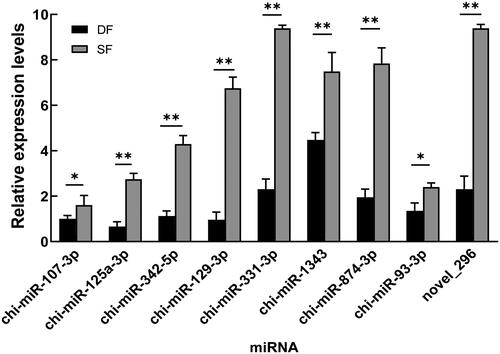
Figure 7. Relative expression of follicular development-related miRNAs in DF and SF granulosa cells of goats. Data is presented as the mean ± SEM (n = 3), * and ** indicate significant differences P < 0.05 and P < 0.01, respectively.
Supplemental Material
Download MS Word (21.5 KB)Supplemental Material
Download MS Word (73.1 KB)Data availability statement
All datasets used in this study are available from the corresponding author on reasonable request.