
Figures & data
Figure 1. Fetal age determination by using (C3-A) real-time ultrasound equipment (Aeroscan-CD-5 Konica Minolta, India) having a convex transducer (C3-A).
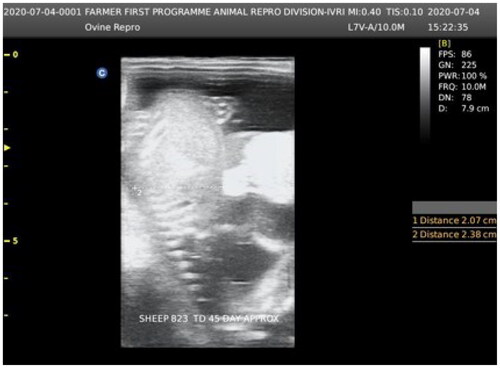
Figure 2. Bluetongue virus serotype-1 (BTV-1), 6 ml (5.5 log10 TCID50/ml) by I/D and IV routes, pregnant sheep at 60th gestation day. Pituitary sections: (A) at 7th DPI, showing normal capillary plexus (arrow) at C-7 DPI in the infected group, ×100; (B) at 7th DPI, showing dilated venous capillary (asterisk) plexus with blood, ×100; (C) mild infiltration of the lymphocyte (circle) in the pars nervosa of the pituitary observed at 14th DPI, H&E, ×400; (D) increased number of the pituicytes (arrowhead) observed in the pars nervosa of the pituitary, 14th DPI, H&E, ×400; (E) at 30th DPI, showing an increased number of pituicytes (curved arrow) with an enlarged nucleus in the pars nervosa, H&E, ×200 and (F) at 60th DPI, infiltration of the eosinophils (circle) between the glandular epithelium of anterior pituitary, H&E, ×400.
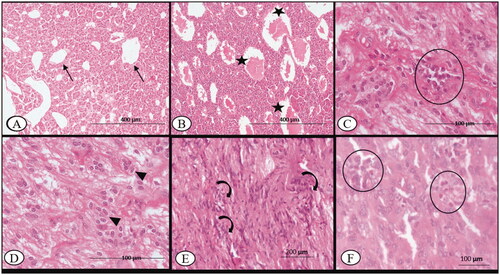
Figure 3. BTV-1, 6 ml (5.5 log10 TCID50/ml) inoculated by I/D and IV routes in sheep at 60th gestation day. H&E section, thyroid sections: (A) at 7th DPI, hyperplasia of the parafollicular cells (C-cells) with few undergoing apoptosis (asterisk), ×400; (B) at 30th DPI, enlarged follicles with flattened epithelium (arrowhead) and with dark to lightly stained collide devoid of reabsorption vacuoles, ×200 and (C) at 30th DPI, showing elongated follicle filled (curved arrow) with the colloid with flattened follicular epithelial cells (arrowhead) on 45th DPI, H&E, ×200.
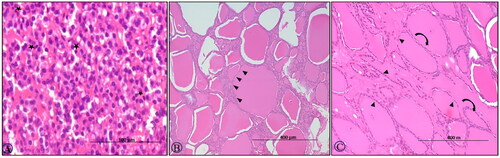
Figure 4. BTV-1, 6 ml (5.5 log10 TCID50/ml) inoculated by I/D and IV routes in sheep at 60th gestation day. H&E section, adrenal sections: (A) at 15th DPI, distorted histoarchitecture with dilated sinusoids containing sparse neutrophils (asterisk) and a few degenerated cells in the zona fasciculate (arrow), ×200; (B) at 15th DPI, few cells in the glomerulosa have a condensed nucleus, hyper-eosinophilic cytoplasm and distinct boundaries (arrow), ×200; (C) at 30th DPI, clumps of the ruptured cells vacuolated cells with eccentrical nuclei in zona glomerulosa (circle), ×200; (D) a higher magnification of (C), ×400; (E) at 45th DPI, hypertrophy and hyperplasia, cell of zona glomerulosa, H&E, ×400 and (F) at 60th DPI, section showing a degenerated cell (arrowhead) in the zona fasciculata H&E, ×400.
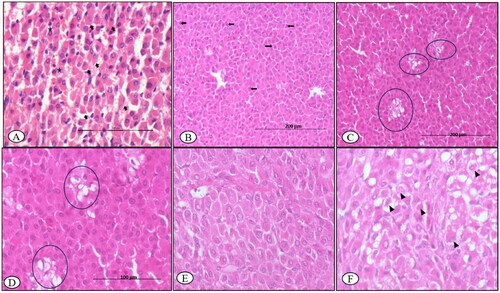
Figure 5. (A) Control section of the adrenal gland, ×200. (B) Control section of the adrenal gland, ×400. (C) Control section of thyroid, ×100. (D) Control section of thyroid, ×200. (E) Control section of the pituitary gland showing normal pituicytes, ×200.
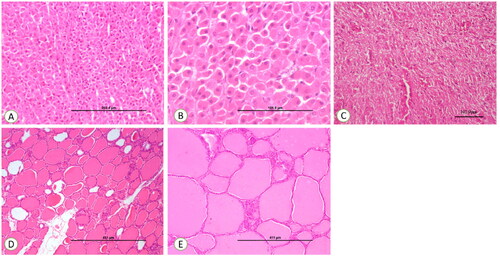
Figure 6. BTV-1, 6 ml (5.5 log10 TCID50/ml) inoculated by I/D and IV routes in sheep at 60th gestation day. H&E section, pancreases sections: (A) at 15th DPI, engorged capillaries (asterisk) in the parenchyma, ×200 and (B) at 30th DPI, disorganized atrophic pancreatic lobules characterized degenerated exocrine acini (arrow) having pycnotic nuclei and darkly stained cytoplasm, ×200.
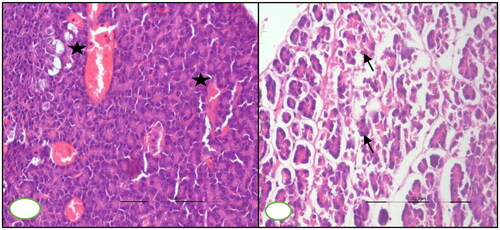
Figure 7. Viral load (Viral copy number of BTV) in the pituitary, adrenal and thyroid glands of infected animals at different time points.
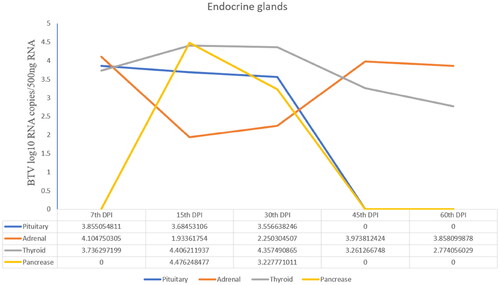
Figure 8. BTV-1 infected sheep at 65th DPI, ABC-IHC-DAB, immunohistochemically stained section, polyclonal BTV-1 primary antibody. (A) Thyroid section showing positive immunolabeling in the cytoplasm of the follicular epithelial cell (asterisk) at 14th DPI, ×200. (B) Adrenal gland section showing positive immunolabelling in the cytoplasm of the cell of zona fasciculata (arrowhead) at 7th DPI, ×400. (C) Adrenal gland section showing positive immunolabelling in the cytoplasm of the cell of zona reticularis projecting in the medullary region (dotted circle) of the gland at 14th DPI, ×400. (D) Pituitary gland showing positive immunolabeling in the cytoplasm of the cell of the adenohypophysis (curved arrow) at 14th DPI, ×200. (E) Antibody control section devoid of any immunolabeling, IHC-DAB, 14th DPI, ×200.
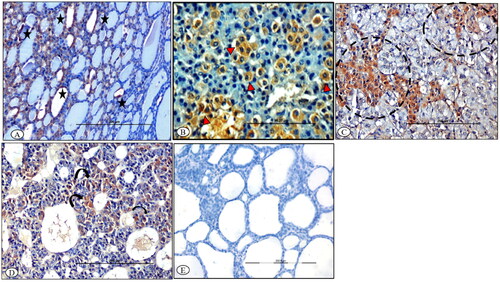
Figure 9. BTV-1 infected sheep at 60th DPI, ABC-IHC-DAB, immunohistochemically stained section, polyclonal caspase-3 primary antibody. (A) Thyroid follicles showing the positive immunostaining for anti caspase-3 in the parafollicular cells of the thyroid as well as in the cytoplasm of the endothelial cell lining the blood vessels (circle). (B) Thyroid follicular epithelial showing the positive immunostaining for anti caspase-3 in the follicular epithelial cells (arrowhead), 30th DPI, DAB-IHC, ×200 (inset: higher magnification, ×400). (C) Positive immunolabeling in the cytoplasm of the infiltrated macrophage (arrowhead), 30th DPI, ×400. (D) No signals were detected in the control group thyroid sections, 30th DPI. (E) No immunostaining was observed in the primary antibody control groups, ×400.
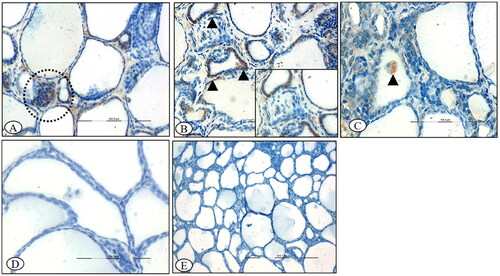
Figure 10. BTV-1 infected sheep at 60th DPI, ABC-IHC-DAB, immunohistochemically stained section, polyclonal caspase-3 primary antibody. (A) Adrenal gland showing the positive immunostaining for anti caspase-3 in the cytoplasm of the cell of zona reticularis cells (circle), ×200. (B) Higher magnification, ×400. (C) Positive immunolabeling in the cytoplasm of zona fasciculata cells (asterisk) that arranged in the linear manner, ×400, 30th DPI. (D) No signals were detected in the control group adrenal sections, 30th DPI, DAB-IHC, ×100.
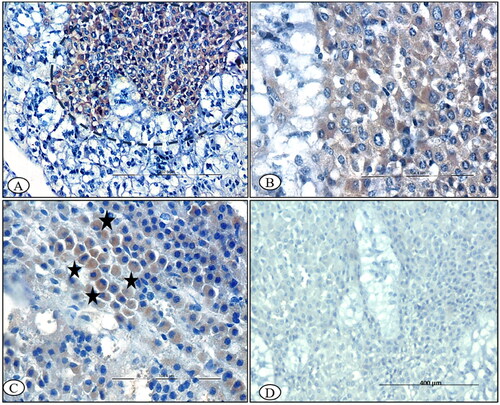
Table 1. Serum hormone concentration (mean ± SE) in the mid-infected group (GrIMP) and control group at different days postinfections.