Figures & data
Table 1. Primer sequence information of 15 microsatellite loci.
Table 2. Genetic diversity of 15 microsatellite locus across five the goat populations in Shanxi province.
Table 3. Genetic diversity of the five goat populations.
Table 4. Wilcoxon sign rank test to evaluate five populations for mutation drift equilibrium under different models.
Figure 1. Allele frequency distribution of the 15 microsatellite loci.
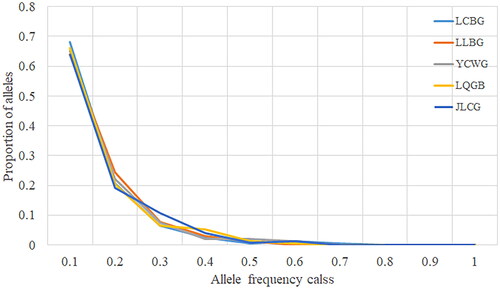
Table 5. Genetic diversity of the five goat populations.
Table 6. Pairwise differences of FST in the five goat populations.
Figure 2. UPGMA phylogenetic tree of five sheep populations based on nei’s genetic distance (DA).
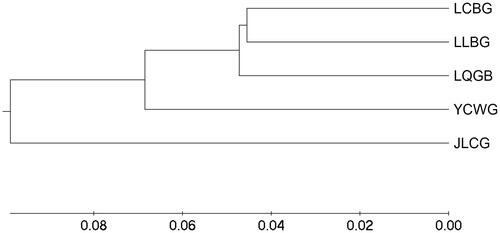
Table 7. Nei’s unbiased measures (1978) of genetic identity and genetic distance.
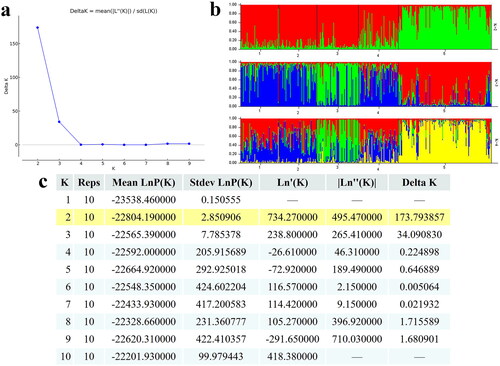
Figure 3. Population structure analysis of five goat populations using model-based clustering method. the abscissa value 1, 2, 3, 4 and 5 in represent LCBG, LLBG, YCWG, LQGB, and JLCG, respectively.