
Figures & data
Figure 1. Morphological and characterization of horse skeletal muscle satellite cells. Morphology of newly isolated (A) and proliferated (B) horse skeletal muscle satellite cells and horse fibroblast cells. (C) Immunofluorescence results of Desmin and Pax7 expression in horse fibroblast cells and horse skeletal muscle satellite cells. Secondary antibodies tagged with green fluorescence were used and nuclei were counterstained by DAPI. Scale bars, 20 µm.
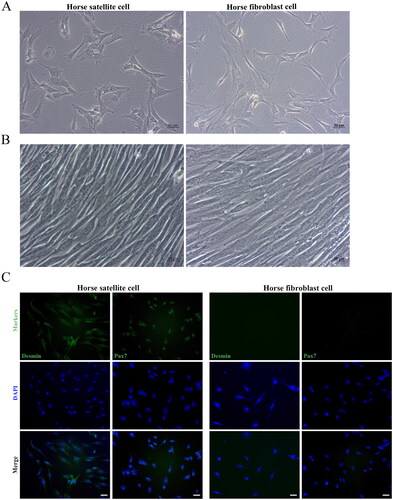
Figure 2. (A) Transfection efficiency and (B) cell viability of horse skeletal muscle satellite cells using different pulsed durations. Values with superscript letters a and b are significantly different between the two groups (p < 0.05).
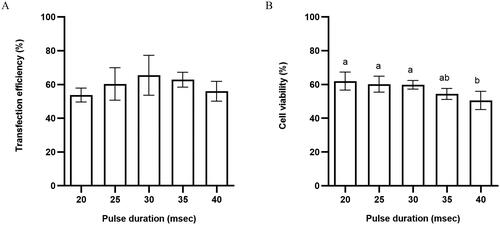
Figure 3. (A) Transfection efficiency and (B) cell viability of horse skeletal muscle satellite cells using different voltages. Values with superscript letters a, b, and c are significantly different between the two groups (p < 0.05).
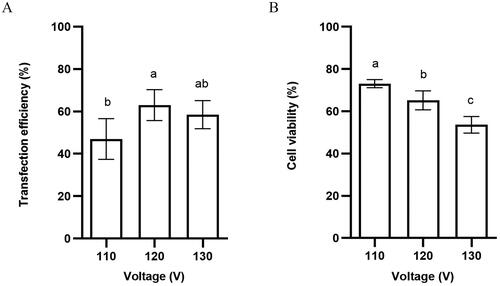
Figure 4. (A) Transfection efficiency and (B) cell viability of horse skeletal muscle satellite cells using different DNA dosages.
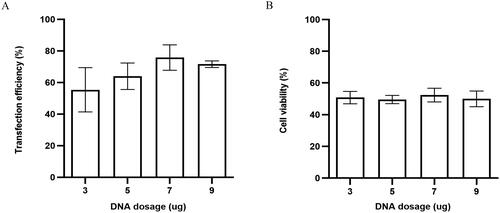
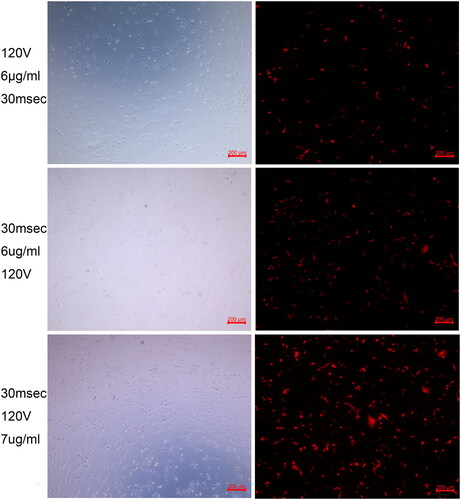
Figure 5. Fluorescence images corresponding to different electroporation transfection conditions showing the exogenous red Tomato protein high expression in horse satellite cells after electroporation transfection with the optimized parameters.
Supplemental Material
Download MS Word (36.1 KB)Data availability statement
The datasets used and/or analyzed during the current study are available from the corresponding author on reasonable request.