
Figures & data
Table 1. Summary of whole genome sequencing data.
Table 2. Chromosome-wise distribution of SNPs and InDels across the genome in Arunachali, Himachali, and Ladakhi yaks.
Figure 1. Categorization of identified SNPs in Arunachali, Himachali and Ladakhi yaks (SNPs were classified: number of effects by impact (high, low, and moderate); number of effects by functional classes (Missense, Nonsense and Silence)).
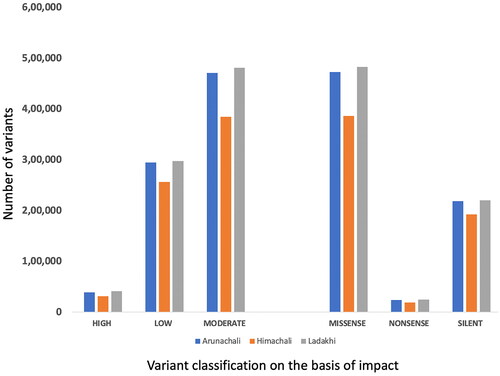
Table 3. Annotation of SNPs and InDels detected in Arunachali, Himachali, and Ladakhi yaks.
Figure 2. The immune related enriched GO terms observed for genes harboring high impact variants. (A) Arunachali yaks. (B) Himachali yaks. (C) Ladakhi yaks.
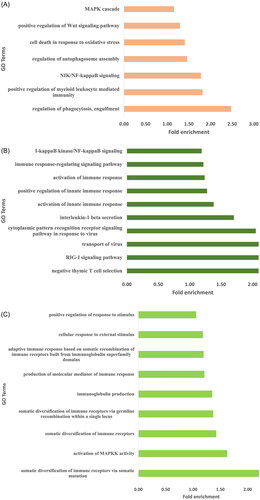
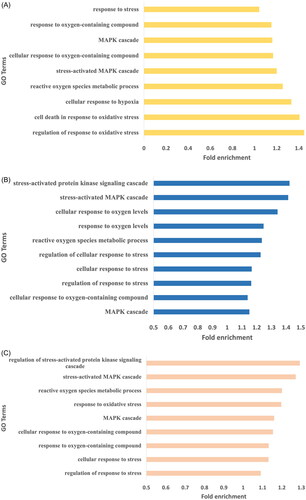
Figure 3. The hypoxia and stress related enriched GO terms observed for genes harboring high impact variants. (A) Arunachali yaks. (B) Himachali yaks. (C) Ladakhi yaks.
Supplemental Material
Download MS Excel (2.2 MB)Data availability statement
The raw data and .vcf file have been submitted to Sequence Read Archive (PRJNA803425) and European Variant Archive (PRJEB50815), respectively.