
Figures & data
Table 1. Target genes, primer sequence, annealing temperature ™ and amplicon size of RT-qPCR.
Figure 1. Paraffin sections of prenatal buffalo fetus (CVRL = 2.2 cm) showing genital ridge (outline), which is located on the ventromedial aspect of mesonephros (MsK) [a]. at 2.7 cm CVRL, the gonadal ridge (shape) shows an increase in size and development of tunica albuginea (TA) and testicular parenchyma (TP) [B, C]. at 3.7 and 4 cm CVRL, an indifferent gonad located between the mesonephric kidney (MsK) and metanephric kidney (MtK) [D, E] and comprises mesenchymal cells, immature RBCs, differentiating fibroblasts (F) and primordial germ cells (arrow) [F]. a strongly positive reaction was seen by PGCs (arrow) for immunostaining with OCT4 [G] and PGP9.5 [H].
![Figure 1. Paraffin sections of prenatal buffalo fetus (CVRL = 2.2 cm) showing genital ridge (outline), which is located on the ventromedial aspect of mesonephros (MsK) [a]. at 2.7 cm CVRL, the gonadal ridge (shape) shows an increase in size and development of tunica albuginea (TA) and testicular parenchyma (TP) [B, C]. at 3.7 and 4 cm CVRL, an indifferent gonad located between the mesonephric kidney (MsK) and metanephric kidney (MtK) [D, E] and comprises mesenchymal cells, immature RBCs, differentiating fibroblasts (F) and primordial germ cells (arrow) [F]. a strongly positive reaction was seen by PGCs (arrow) for immunostaining with OCT4 [G] and PGP9.5 [H].](/cms/asset/525616cd-1a56-41db-a74b-f31e08213984/labt_a_2285509_f0001_c.jpg)
Figure 2. Paraffin sections of prenatal testicular tissue at 5.2 cm CVRL showing the formation of prospective seminiferous cords [A] with PGCs, which stain immunopositive for OCT4 [B] and PGP9.5 [C]. at 7.6 cm CVRL, fully formed cords were seen with gonocytes (arrow) located in the center and toward the periphery of the cords [D]. These gonocytes stained strongly positive for OCT4 [E] and PGP9.5 [F]. at 9.5 cm CVRL organized testicular cords were seen with gonocytes (arrow) localized in the center of cords while few were seen toward the periphery [G]. These cells gave a strong positive result for OCT4 [H] and PGP9.5 [I, J]. at 22 cm CVRL, well-organized testicular cords were seen with gonocytes in the center and toward the periphery of the cords [K], noted by the extension of their cytoplasmic processes seen when immunostained with OCT4 [L]. by 255 days of gestation, extensive and tortuous seminiferous cords were seen with more gonocytes [M] which stains strongly positive for PGP9.5 [N, O].
![Figure 2. Paraffin sections of prenatal testicular tissue at 5.2 cm CVRL showing the formation of prospective seminiferous cords [A] with PGCs, which stain immunopositive for OCT4 [B] and PGP9.5 [C]. at 7.6 cm CVRL, fully formed cords were seen with gonocytes (arrow) located in the center and toward the periphery of the cords [D]. These gonocytes stained strongly positive for OCT4 [E] and PGP9.5 [F]. at 9.5 cm CVRL organized testicular cords were seen with gonocytes (arrow) localized in the center of cords while few were seen toward the periphery [G]. These cells gave a strong positive result for OCT4 [H] and PGP9.5 [I, J]. at 22 cm CVRL, well-organized testicular cords were seen with gonocytes in the center and toward the periphery of the cords [K], noted by the extension of their cytoplasmic processes seen when immunostained with OCT4 [L]. by 255 days of gestation, extensive and tortuous seminiferous cords were seen with more gonocytes [M] which stains strongly positive for PGP9.5 [N, O].](/cms/asset/cce83813-6bb8-4f1b-ab2b-7033c5f8f2e0/labt_a_2285509_f0002_c.jpg)
Figure 3. Paraffin sections of neonatal buffalo testes showing gonocytes in the center and toward the periphery of developed seminiferous tubules loosely supported by Sertoli cells [a], Immunostaining for OCT 4, inset with a magnified view of OCT4 immunoreaction [B], and PGP 9.5 [C] both yielded strong positive reactions confirming the presence of male germ cells and their pluripotency. Paraffin sections of prepubertal buffalo testes show that amination had occurred [D]. The proportion of cells positive for OCT4 [E] had reduced in prepubertal life, while a good number of PGP 9.5 [F] positive cells were seen. Paraffin sections of adult buffalo testes show large seminiferous tubules with SSCs located at the periphery of the basement membrane [G], fewer cells were positive for OCT4 [H], but good numbers of SSCs were positive for PGP 9.5 [I].
![Figure 3. Paraffin sections of neonatal buffalo testes showing gonocytes in the center and toward the periphery of developed seminiferous tubules loosely supported by Sertoli cells [a], Immunostaining for OCT 4, inset with a magnified view of OCT4 immunoreaction [B], and PGP 9.5 [C] both yielded strong positive reactions confirming the presence of male germ cells and their pluripotency. Paraffin sections of prepubertal buffalo testes show that amination had occurred [D]. The proportion of cells positive for OCT4 [E] had reduced in prepubertal life, while a good number of PGP 9.5 [F] positive cells were seen. Paraffin sections of adult buffalo testes show large seminiferous tubules with SSCs located at the periphery of the basement membrane [G], fewer cells were positive for OCT4 [H], but good numbers of SSCs were positive for PGP 9.5 [I].](/cms/asset/cc41dd74-3788-468c-a621-642c2cad2bc9/labt_a_2285509_f0003_c.jpg)
Figure 4. Proportion of positive cells for OCT4 (A) and PGP9.5 (B) in all prenatal and postnatal life stages.
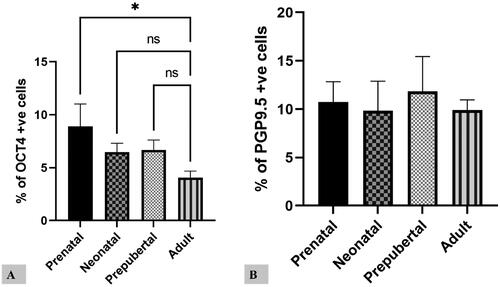
Table 2. Average proportion of positive cells in prenatal and postnatal stages.
Figure 5. Relative gene expression of OCT 4 and PGP 9.5 in testes of buffalo.
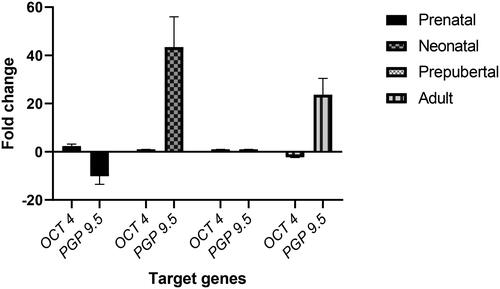
Figure 6. Transmission electron micrographs of prenatal testicular tissue illustrating the morphology of spermatogonial stem cells (SSC) ultrastructure. A: Semi-thin section of the early stage of development (5.2 cm CVRL) showing PGCs in between the mesenchymal cells and fibroblasts, which were developing into peritubular myoid cells. At places, they seemed to be forming testicular cords (dotted outline). Toluidine blue stain × 1000; B: The PGCs (arrow) were large, round cells with large nuclei and a thin rim of cytoplasm. Heterochromatin was dispersed in between the euchromatin in the nucleus. The developing myoid cells (M) had a sizeable elongated nucleus that occupied most parts of the cell. Toluidine blue stain × 1000; C: Electron micrograph of prenatal development at 7.6 cm CVRL showing testicular cords with gonocytes (G) and Sertoli cells surrounded by a thin basement membrane. The gonocytes were comparatively larger cells with large nuclei. The basement membrane separated the testicular cords from the blood vessels (BV). Several Leydig cells were observed in between the testicular cords. × 570; C: Electron micrograph of prenatal development at 7.6 cm CVRL showing testicular cords with gonocytes (G) and Sertoli cells surrounded by a thin basement membrane. The gonocytes were comparatively larger cells with large nuclei. The basement membrane separated the testicular cords from the blood vessels (BV). Several Leydig cells were observed in between the testicular cords. × 570. D: Magnified 20 C (box) image showing Leydig cells between the testicular cords. × 1550. E: Semi-thin section of the late gestational period (8 months of age), well-organized testicular cords with the distinctly visible basement membrane. Toluidine blue stain × 1000. F: Electron micrograph of the late gestational period showing testicular cords, gonocyte and pre-Sertoli cells. The nuclei of gonocytes were giant, surrounded by a thin rim of cytoplasm and distinctly visible nucleoli. × 830.
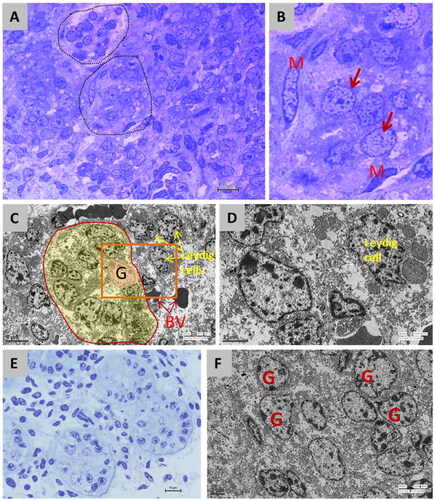
Figure 7. Semi-thin section of neonatal testicular tissue showing well-organized testicular cords lined with distinct basement membrane [A] and electron micrograph showing gonocytes located primarily on the center of the cords with large nuclei and distinct nucleoli [B]. Semi-thin section of the prepubertal period showing seminiferous tubules with large germ cells (G) and Sertoli cells [C] and electron micrograph of the same showing large nuclei of germ cell with the heterochromatin material dispersed in euchromatin [D]. Semi-thin section of the adult period showed spermatogonia (S) which were round, oval to ellipsoidal cells lying over the basement membrane [E]. Electron micrograph of adult testicular tissue showing spermatogonia with a large round nucleus (N) lying over the basement membrane (BM) with a high nucleus-to-cytoplasm ratio [F]. The heterochromatin clumps (Hc) were distributed in between the euchromatic material (Ec), which gave the nucleus a mottled appearance [G]. the cytoplasm was filled with consisted of numerous mitochondria (M) with elongated mitochondrial cristae, strands of smooth endoplasmic reticulum (SER), and parallel strands of rough endoplasmic reticulum (rER) with few vacuoles, Golgi complex and lipid droplets (L) at places [H, I]. Graphically conceptualized view of an SSC and its location [J].
![Figure 7. Semi-thin section of neonatal testicular tissue showing well-organized testicular cords lined with distinct basement membrane [A] and electron micrograph showing gonocytes located primarily on the center of the cords with large nuclei and distinct nucleoli [B]. Semi-thin section of the prepubertal period showing seminiferous tubules with large germ cells (G) and Sertoli cells [C] and electron micrograph of the same showing large nuclei of germ cell with the heterochromatin material dispersed in euchromatin [D]. Semi-thin section of the adult period showed spermatogonia (S) which were round, oval to ellipsoidal cells lying over the basement membrane [E]. Electron micrograph of adult testicular tissue showing spermatogonia with a large round nucleus (N) lying over the basement membrane (BM) with a high nucleus-to-cytoplasm ratio [F]. The heterochromatin clumps (Hc) were distributed in between the euchromatic material (Ec), which gave the nucleus a mottled appearance [G]. the cytoplasm was filled with consisted of numerous mitochondria (M) with elongated mitochondrial cristae, strands of smooth endoplasmic reticulum (SER), and parallel strands of rough endoplasmic reticulum (rER) with few vacuoles, Golgi complex and lipid droplets (L) at places [H, I]. Graphically conceptualized view of an SSC and its location [J].](/cms/asset/f526b8ad-6ea7-473f-910a-19793f61c5c3/labt_a_2285509_f0007_c.jpg)