
Figures & data
Figure 1. Histomorphology of longissimus dorsi muscle and circRNAs distribution analysis. (A), HE staining of longissimus dorsi tissue of DBG embryo at day 75; (B), HE staining of longissimus dorsi tissue of DBG 1 day after birth; (C), distribution of all identified circRNAs on chromosomes; (D), Principal component analysis (PCA) was performed on all identified circRNAs in the longissimus dorsi muscle of 12 DBGs.
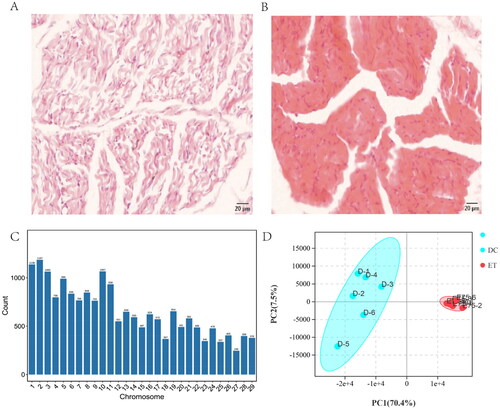
Table 1. Comparison of abbreviations and full names.
Figure 2. Analysis of circRNA expression in two stages of skeletal muscle development of DBG: (a), clustering heatmap of DEcircRNA and DE_HGs; (B), schematic diagram of obtaining the full length of circRNA by PCR amplification; (C), agarose gel electrophoresis of PCR amplification products; (D), expression levels of circRNA (RPM) by RNA_seq; (E), relative expression level of circRNA by RT_qPCR; “*”: P < 0.05; “**”: P < 0.01.
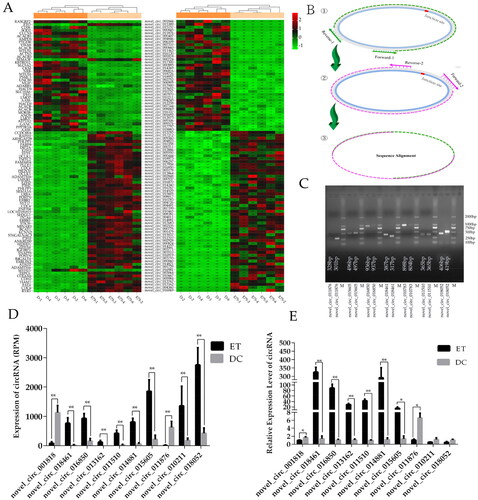
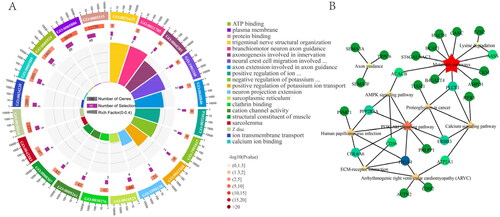
Figure 3. Functional analysis of DEcircRNA in two stages of skeletal muscle development of DBG: (A), top 20 pathways of GO enrichment analysis; (B), top 10 pathways of KEGG enrichment analysis.
Supplemental Material
Download Zip (1.3 MB)Data availability statement
All data of RNA_seq data was cited and download from NCBI database (PRJNA749391).