
Figures & data
Table 1. The amino acids sequence of the three Nk-lysin peptides.
Table 2. The primers list for detection and characterization of beta-lactamases and quinolone resistance genes.
Figure 1. Antimicrobial activity of Nk-lysin peptides of chicken, bovine and human against Salmonella typhimurium. Data presented as means (±SD) of three independent repeats in triplicate (*p˂0.03 compared to control group).
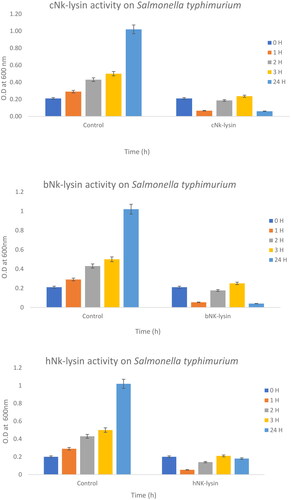
Table 3. Antimicrobial activity of Nk-lysin peptides of chicken, bovine and human against gram-positive and gram-negative bacteria.
Figure 2. Colony counting assay of Nk-lysin peptides of chicken, bovine, human against Salmonella typhimurium. Data presented as means (±SD) of three independent repeats in triplicate (*p˂0.01 compared to control group).
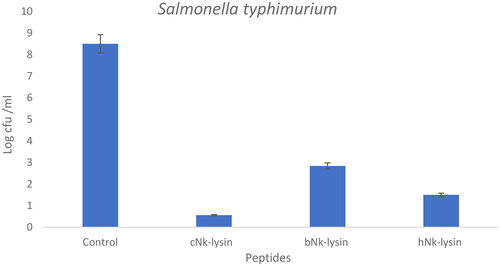
Figure 3. Growth kinetic activities of 2xMIC of chicken, bovine and human Nk-lysin peptide against Streptococcus pyogenes (ATCC 19615) (*p˂0.02 compared to control group) and Streptococcus mutans (isolate) (*p˂0.02 compared to control group), Escherichia coli (ATCC 11775) (*p˂0.03 compared to control group), Klebsiella oxytoca (ATCC 49131) (*p˂0.03 compared to control group), Pseudomonas aeruginosa (ATCC 9027) (*p˂0.04 compared to control group), Salmonella typhimurium (ATCC 14028), Klebsiella Pneumonia (isolate) (*p˂0.02 compared to control group)and Shigella sonnei (ATCC 25931) (*p˂0.03 compared to control group). Data presented as means (±SD) of three independent repeats in triplicate.
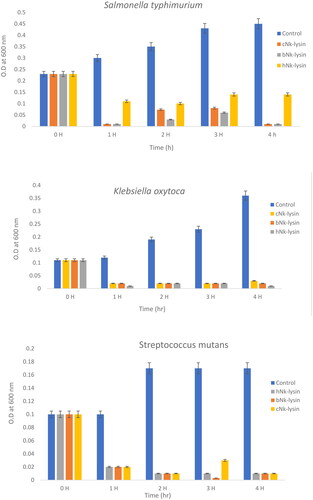
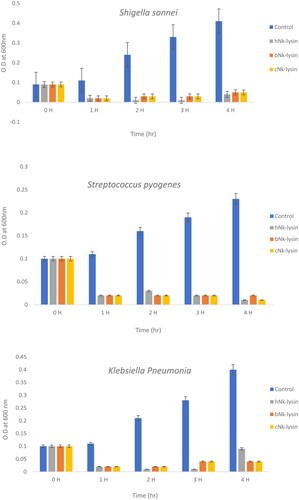
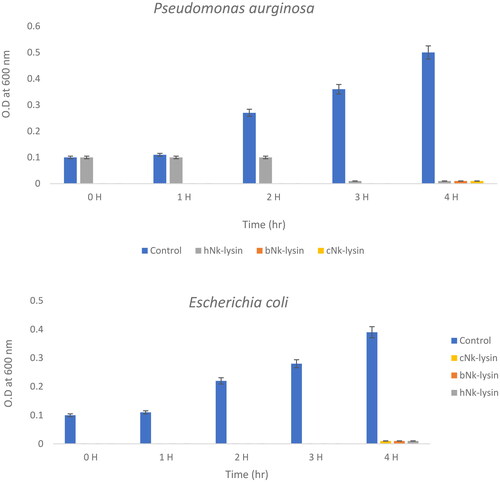
Figure 4. The bacterial lytic effect of 1× MIC bovine Nk-lysin peptide against Salmonella typhimurium (ATCC 14028) at different inoculum concentrations. Data presented as means (±SD) of three independent repeats in triplicate. (* p ˂ 0.01 compared to control group).
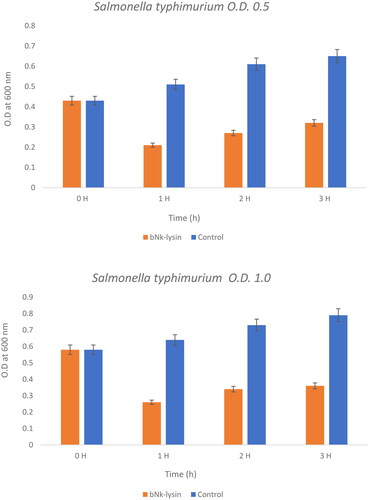
Figure 5. The bacterial lytic effect of 1x MIC bovine Nk-lysin peptide against Salmonella typhimurium (ATCC 14028) at different inoculum concentrations. Data presented as means (±SD) of three independent repeats in triplicate. (*p˂0.01 compared to control group).
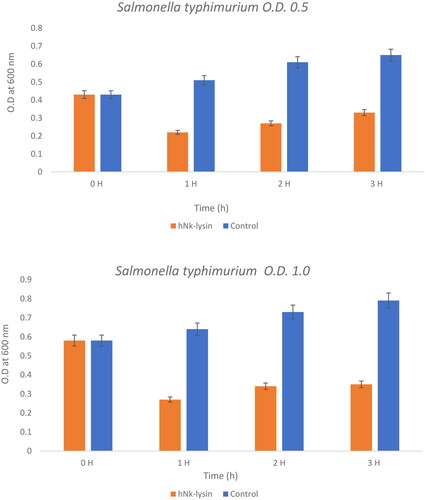
Figure 6. DNA/RNA release of Salmonella typhimurium (ATCC 14028) bacterial cells after incubation with (Nk-lysin peptides of chicken, bovine, human) at 37 °C. Data presented as means (±SD) of three independent repeats in triplicate. (*p˂0.01 compared to control group).
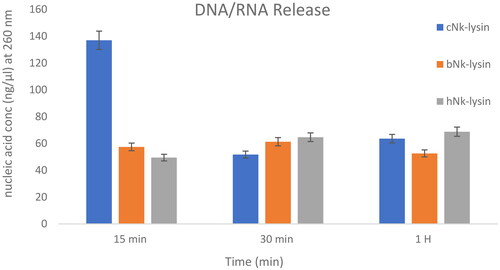
Figure 7. The amplified fragment of CTX-M1 gene with 499 bp, where M (DNA ladder =100 bp), 1 (Salmonella typhimurium ATCC 14028 untreated and treated cells), 2 (Pseudomonas aeruginosa ATCC 9027 untreated and treated cells), 3 (Klebsiella oxytoca ATCC 49131 untreated and treated cells), 4 (Streptococcus pyrogens ATCC 19615 untreated and treated cells) and arrows indicate gene in untreated bacteria whereas empty well indicates treated bacteria after challenge with Nk-lysin.
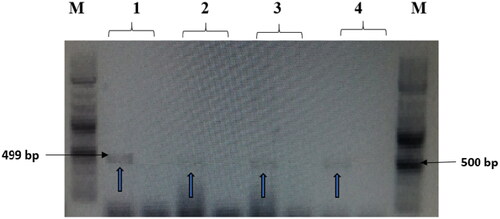
Figure 8. The amplified fragment of CTX-M8 gene with 307 bp, where M (DNA ladder =100 bp), 1 (Salmonella typhimurium ATCC 14028 untreated and treated cells), 2 (Pseudomonas aeruginosa ATCC 9027 untreated and treated cells), 3 (Klebsiella oxytoca ATCC 49131 untreated and treated cells), 4 (Streptococcus pyrogens ATCC 19615 untreated and treated cells) and arrows indicate gene in untreated bacteria whereas empty well indicates treated bacteria after challenge with Nk-lysin.
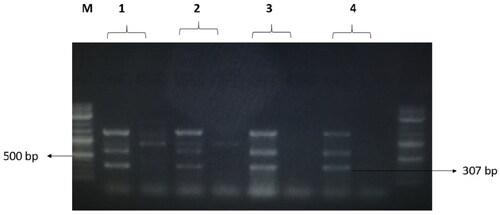
Figure 9. The amplified fragment of CTX-M9 gene with 474 bp, where M (DNA ladder =100 bp), 1 (Salmonella typhimurium ATCC 14028 untreated and treated cells), 2 (Pseudomonas aeruginosa ATCC 9027 untreated and treated cells), 3 (Klebsiella oxytoca ATCC 49131 untreated and treated cells), 4 (Streptococcus pyrogens ATCC 19615 untreated and treated cells) and arrows indicate gene in untreated bacteria whereas empty well indicates treated bacteria after challenge with Nk-lysin.
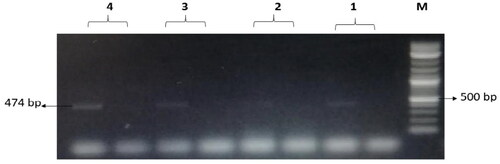
Table 4. Detection of beta-lactam and quinolone resistance genes after treatment with Nk-lysin peptides.
Table 5. The antiviral activity of Nk-lysin peptides of chicken, bovine and human at concentration (80 µg/ml) against Rotavirus sa-11.