
Figures & data
Table 1. Primer pairs designed for sheep IGFALS.
Table 2. Primer pairs designed for KASPar assay.
Figure 1. Descriptive statistics of scrotal circumference size at different stages. (A) The violin plot of scrotal circumference. (B) The coefficient of variation of scrotal circumference.
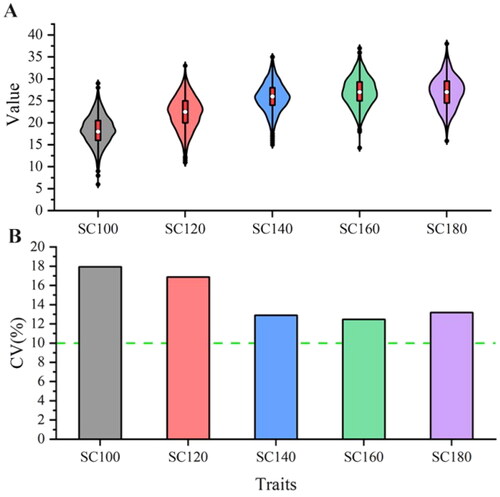
Table 3. Estimation of scrotal circumference variance components and heritability at different stages.
Figure 2. PCR amplification of the target fragments of the ovine IGFALS genes. Note: M: DL2000 DNA Marker; 1–10: PCR products
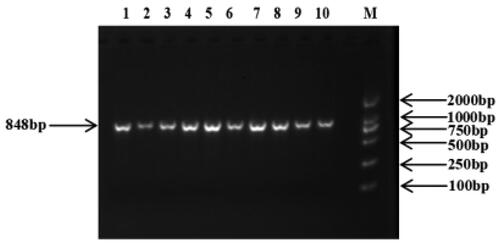
Figure 3. Image of the sequencing peaks of sheep IGFALS g.918 G > C loci.
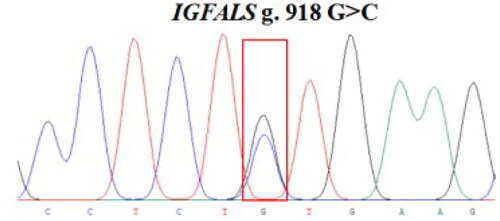
Figure 4. Kaspar–based single nucleotide polymorphism (SNP) genotyping of sheep IGFALS g.918 G > C.

Table 4. Genotype frequency, allele frequency, and genetic diversity of IGFALS g.918G > C sites.
Table 5. Association of different genotypes due to SNP in IGFALS with the scrotal circumference in sheep.