
Figures & data
Table 1. Annotation information of all SNPs in 8 yak populations.
Figure 1. Cluster differentiation and affinities of yak populations. (A) Phylogenetic tree. (B) Principal component analysis of yak populations. (C) Ancestral component analysis. (D) Analysis of genetic relationships in yak populations.
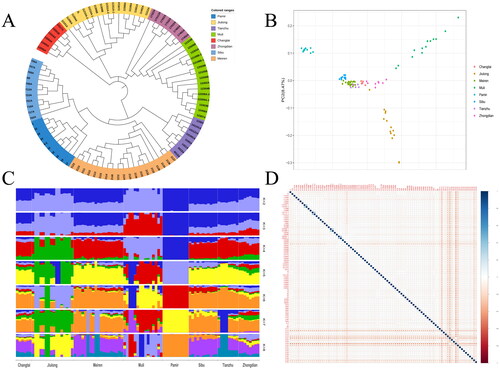
Figure 2. Population genomics analysis. (A) analysis of heterozygosity in yak populations. (B) Linkage disequilibrium analysis. (C,D) ROH analysis of yak populations. (E) Population differentiation index analysis. (F) Genetic polymorphism analysis.
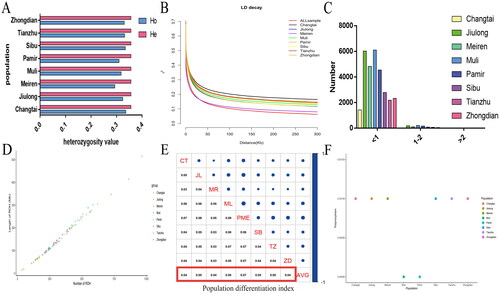
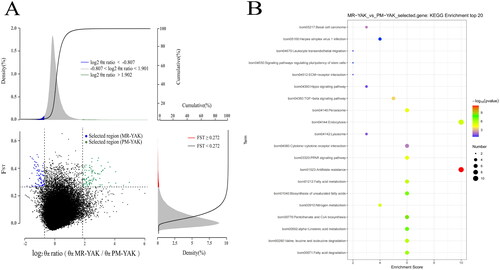
Figure 3. Enrichment analysis results. (A) Select signal analysis. Based on θπ ratio and Fst analysis to take the intersection for selection signal analysis. The horizontal coordinate is the ratio of θπ (MR/PM) and the vertical coordinate is the Fst value, which corresponds to the frequency distribution plots on the top and on the right, respectively, and the dot plots in the centre represent the corresponding Fst and θπ ratios within different windows. The top blue and green regions are the regions selected by θπ, the red regions are the regions selected by Fst, and the Middle blue and green regions are the intersection of Fst and θπ, i.e., the candidate regions. The blue dots are candidate areas for MR and the green dots are candidate areas for PM yaks. (B) KEGG enrichment analysis of genes in selected regions(the area of green dots in ).
Supplemental Material
Download MS Excel (35.5 KB)Supplemental Material
Download MS Excel (8.8 KB)Supplemental Material
Download MS Excel (1.1 KB)Supplemental Material
Download MS Excel (1.3 KB)Supplemental Material
Download MS Excel (2.8 MB)Supplemental Material
Download MS Excel (19.5 KB)Supplemental Material
Download MS Excel (67.2 KB)Supplemental Material
Download MS Excel (4 KB)Supplemental Material
Download MS Excel (75.6 KB)Data availability statement
The datasets generated during the current study are available in the [FigShare] repository, [10.6084/m9.figshare.23723817].