
Figures & data
Figure 1. Raman spectra of V. anguillarum strains in A: TCBS medium, B: BHI medium, C: TSA medium.
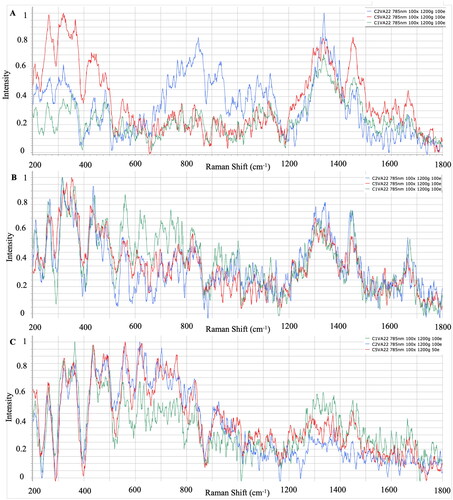
Figure 2. Raman spectra of Y. ruckeri strains in A: WS medium, B: BHI medium, C: TSA medium.
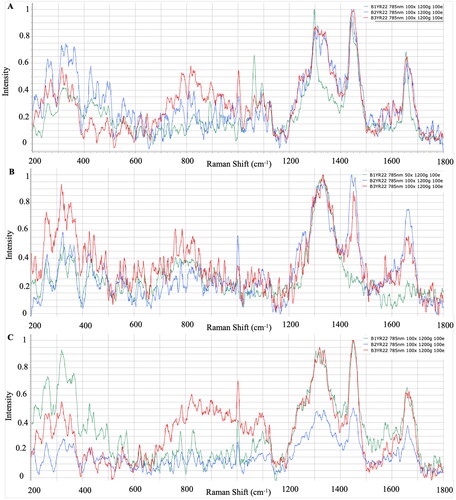
Figure 3. Raman spectra of L. garvieae strains on A: LG medium, B: BHI medium, C: TSA medium.
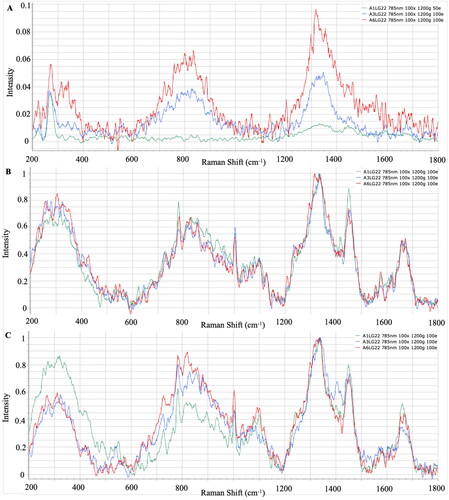
Figure 4. A: 24 and 48 h Raman spectra of V. anguillarum strains (TSA), B: 24 and 48 h Raman spectra of Y. ruckeri strains (TSA), C: 24 and 48-hour Raman spectra of L. garvieae strains (TSA).
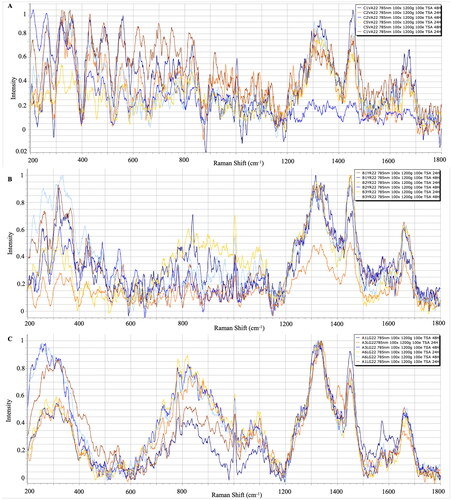
Figure 5. A: PCA of the different spectrum obtained from different media used for L. garvieae, B: PCA of the different spectrum obtained from different media used for V. anguillarum, C: PCA of the different spectrum obtained from different media used for Y. ruckeri.
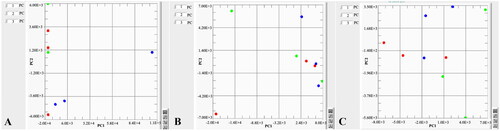
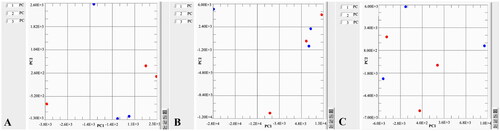
Figure 6. A: PCA of the 24 and 48 h spectrum obtained from L. garvieae strain, B: PCA of the 24 and 48 h spectra obtained from strain, C: PCA of the 24 and 48 h spectra obtained from Y. ruckeri strains.
Data availability statement
The data that support the findings of this study are available from the corresponding author, [Dinçtürk, E.], upon reasonable request.