
Figures & data
Figure 1. Map highlighting the breeding tract of Chhattisgarhi buffalo.
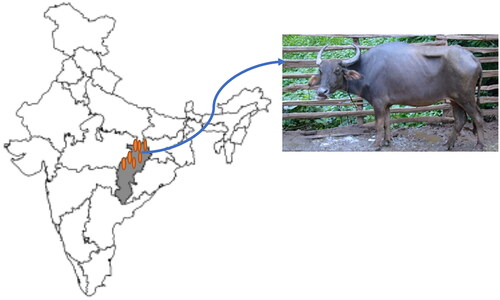
Figure 2. L-shaped mode shift curve showing absence of recent genetic bottleneck in Chhattisgarhi population.
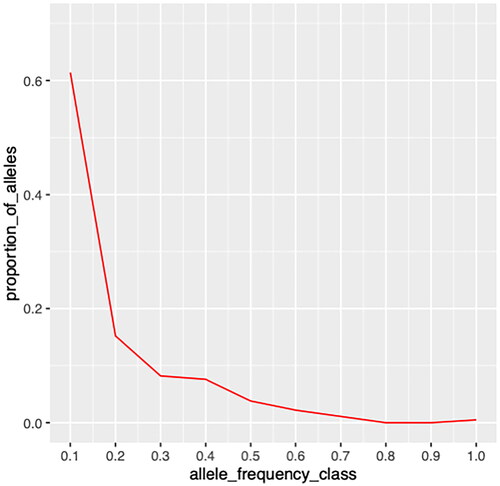
Table 1. Mutation-drift equilibrium, heterozygosity excess under different mutation models in Chhattisgarhi population.
Figure 3. Heat-map showing pairwise FST among six buffalo populations.
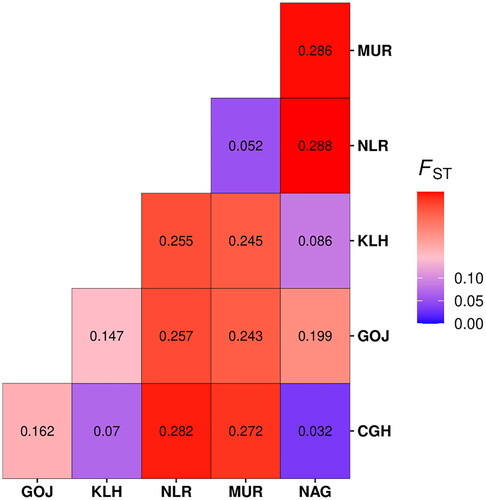
Figure 4. UPGMA tree inferring evolutionary distances of the six buffalo populations.
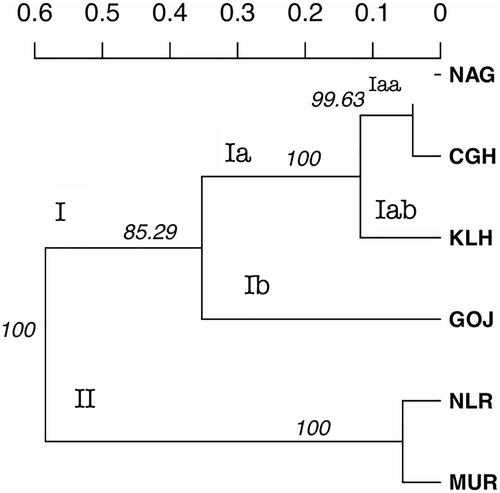
Figure 5. Scatter plot of individuals from buffalo populations clustered through discriminant analysis of principal components (DAPC).
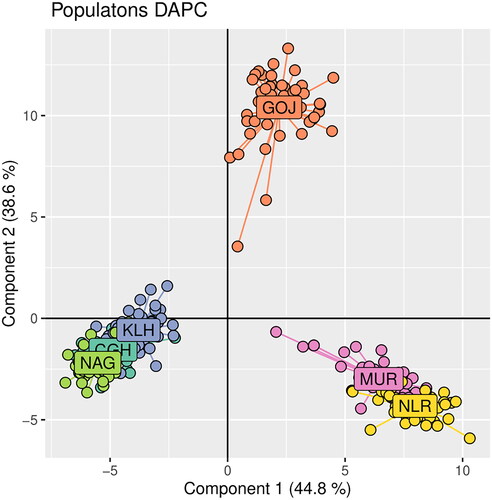
Figure 6. Cluster of individuals from different populations through bayesian genetic approach of STRUCTURE. Bars depict the individuals in a population and the color corresponds to the inheritance from different breeds. The 6 population studied are represented as CGH – Chhattisgarhi, GOJ – Gojri, KLH – Kalahandi, MUR – Murrah, NAG – Nagpuri, and NIR – Nili-Ravi.
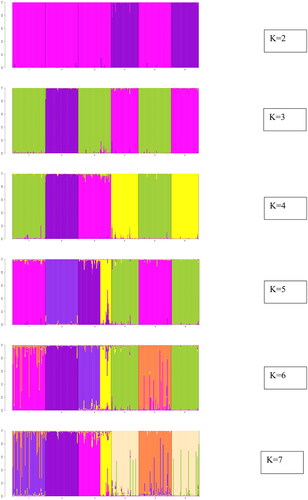
Figure 7. Evano’s plot showing the most likely number of genetic clusters present in the population.
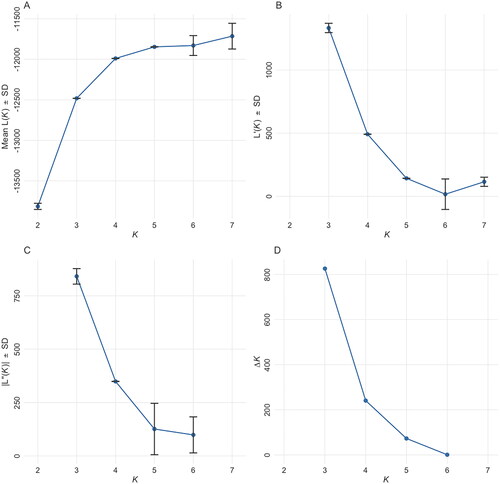
Table 2. Locus-wise genetic indices based on overall microsatellite data of six buffalo populations.
Table 3. Population-wise genetic indices of six buffalo populations.
Table 4. Results of STRUCTURE showing inferred cluster and ancestry of buffalo populations at K = 3.