
Figures & data
Table 1. Analysis of the starter and grower diets used in the experiments for the percentage of ingredients and stated composition (%, as-fed basis).
Table 2. Postbiotic effect of microbial lysozyme on performance.
Table 3. Postbiotic effect of microbial lysozyme on the intestinal integrity and intestinal lactobacillus count (log10 CFU/g).
Figure 1. Anti-inflammatory assessments (a: IL-1β; b: CXCL8) in both groups. Different letters above the bars indicate statistically significant difference between groups at p value below 0.05.
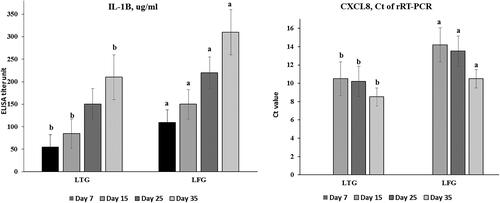
Figure 2. Cellular immune modulation (a: MΦ count; b: phagocytic index) in both groups. Different letters above the bars indicate statistically significant difference between groups at p value below 0.05.
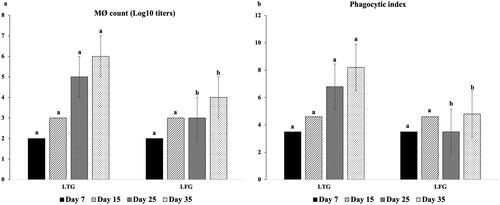
Figure 3. Local (IgA) immune modulation in both groups. Different letters above the bars indicate statistically significant difference between groups at p value below 0.05.
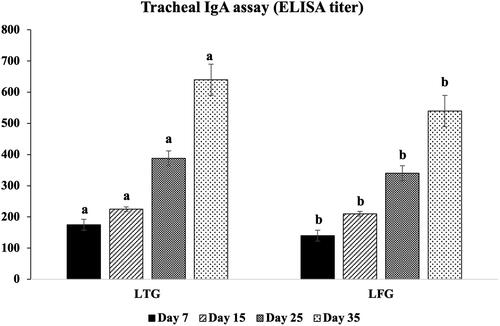
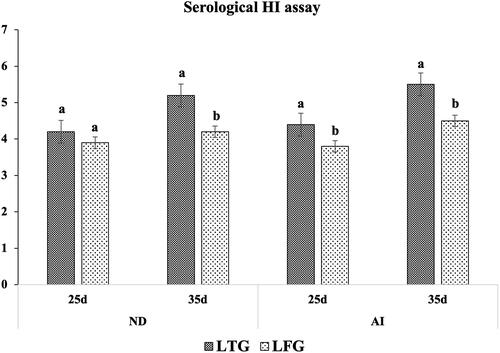
Figure 4. Humoral (HI titers) immune modulation in both groups. Different letters above the bars indicate statistically significant difference between groups at p value below 0.05.
Data availability statement
The data of this study are available from the corresponding authors, [MAA & AO], upon reasonable request.