Figures & data
Figure 1. LY294002 attenuates MMP9 expression and P65 nuclear translocation in mammary epithelial cells. (A) Mammary epithelial cells were pretreated with LY294002. DMSO was used as a negative control. The expression of p-AKT, AKT, p-mTOR, mTOR and MMP9 were measured by Western blot analysis. β-actin expression was evaluated as an internal control. (B) Quantification of p-AKT, AKT, p-mTOR, mTOR and MMP9 expression from the Western blots in panel A. (C) Mammary epithelial cells were treated with LY294002 for. Nuclear and cytoplasmic extracts were prepared, and Western blot analysis was performed. Histone H3 and β-actin were used as an internal control for nuclear and cytoplasmic extracts respectively. (D) Quantification of nuclear and cytoplasmic P65 expression from the Western blots in panel C. Data are expressed as mean ± SEM of three independent experiments. *p < 0.05 and **p < 0.01 compared with the control.
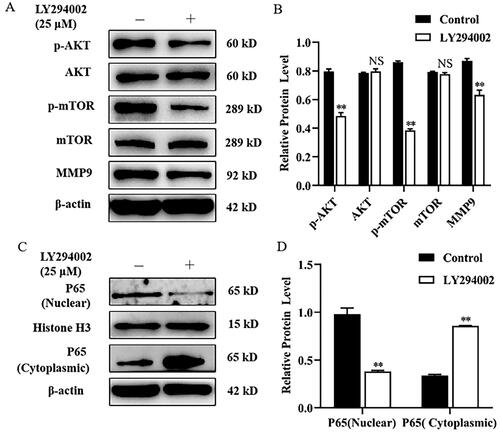
Figure 2. Rapamycin decreased MMP9 expression and P65 nuclear translocation in mammary epithelial cells. (A) Mammary epithelial cells were pretreated with Rapamycin. The expression of p-mTOR, mTOR and MMP9 were measured by Western blot analysis. β-actin expression was evaluated as an internal control. (B) Quantification of p-mTOR, mTOR and MMP9 expression from the Western blots in panel A. (C) Mammary epithelial cells were treated with Rapamycin. Nuclear and cytoplasmic extracts were prepared, and Western blot analysis was performed. Histone H3 and β-actin were used as an internal control for nuclear and cytoplasmic extracts, respectively. (D) Quantification of nuclear and cytoplasmic P65 expression from the Western blots in panel C. Data are expressed as mean ± SEM of three independent experiments. *p < 0.05 and **p < 0.01 compared with the control.
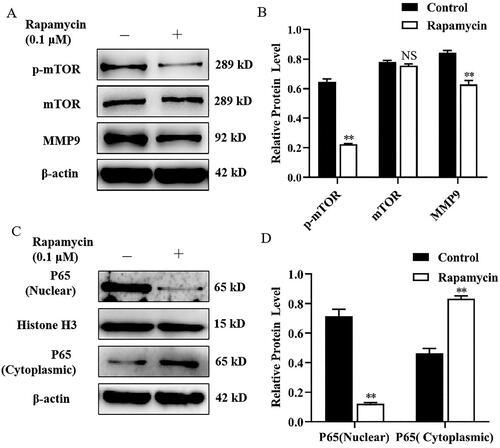
Figure 3. Celastrol suppressed MMP9 expression and P65 nuclear translocation in mammary epithelial cells. (A) Mammary epithelial cells were pretreated with Celastrol. The expression of MMP9 was measured by Western blot analysis. β-actin expression was evaluated as an internal control. (B) Quantification of MMP9 expression from the Western blots in panel A. (C) Mammary epithelial cells were treated with Celastrol for. Nuclear and cytoplasmic extracts were prepared and Western blot analysis was performed. Histone H3 and β-actin were used as an internal control for nuclear and cytoplasmic extracts, respectively. (D) Quantification of nuclear and cytoplasmic P65 expression from the Western blots in Panel C. Data are expressed as mean ± SEM of three independent experiments. *p < 0.05 and **p < 0.01 compared with the control.
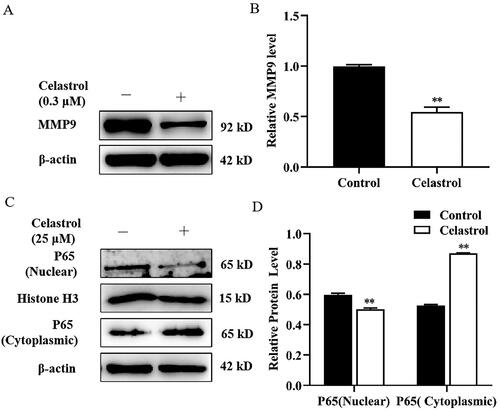
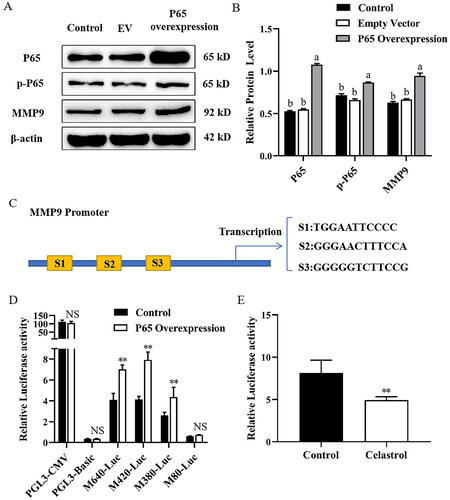
Figure 4. Effect of transcription factor NF-κB (P65) on MMP9 promoter activity in mammary epithelial cells. (A) Mammary epithelial cells were transfected with pcDNA3.1-NF-κB (P65) plasmid. The levels of P65, p-P65 and MMP9 were determined by Western blotting. Protein expression levels of β-actin in cell lysates were used as a control. (B) Quantification of P65, p-P65 and MMP9 expression from the Western blots in panel A. (C) MMP9 promoter image. NFkB binding sites were pointed out as S1 (−612/−602), S2 (−432/−421) and S3 (−395/−384). (D) Mammary epithelial cells were co-transfected with a series of MMP9-PGL3 plasmid including MMP9-640-Luc (M640-Luc), MMP9-420-Luc (M420-Luc), MMP9-380-Luc (M380-Luc) and MMP9-80-Luc (M80-Luc), which contains a deletion of the MMP9 gene promoter 5’-flanking region, and pcDNA3.1-NF-κB (P65) plasmid for 48h. Luciferase activity was normalized to the Renilla activity in each cell lysate. (E) Mammary epithelial cells were co-transfected with M420-Luc plasmid and pcDNA3.1-NF-κB (P65) plasmid for 6h. Then cells were treated with Celastrol, and DMSO was used as a negative control. Luciferase activity was normalized with the Renilla activity in each cell. Data are expressed as mean ± SEM of three independent experiments. For B, means without a common letter (a,b) differ at p < 0.05. For C and D, *p < 0.05; **p < 0.01.