Figures & data
Table 1. Primers designed for selected aptamer sequence.
Table 2. Gene name, sequence and product size for X and Y specific primers.
Figure 1. (a) Extraction and PCR based amplification of DNA aptamers by SELEX: Lane 1–5: 50 bp ladder (thermo scientific; cat#SM0371), amplified aptamers library, no template control (NTC), amplified aptamers library and NTC respectively; (b) PCR amplification product of eluted aptamers after each round of cell-SELEX.
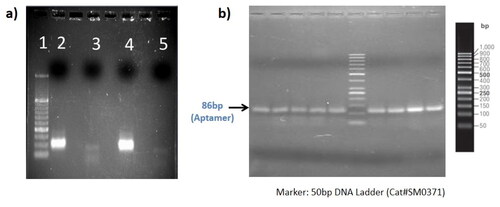
Table 3. G Scores for the shortlisted aptamers.
Figure 2. (a) 2D And (b) 3D structures for DNA aptamer 29a. The DNA aptamer nucleotide sequence was used as input for 2D and 3D structure determination using mfold server. The given structures were selected based on the minimum gibbs free energy (ΔG = −2.57).
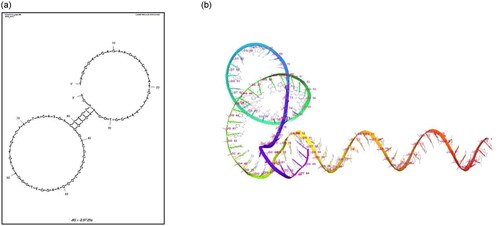
Figure 3. (a) Fluorescence and (b) phase contrast picture of aptamer bound sperm cells in mixed semen population of bovine.
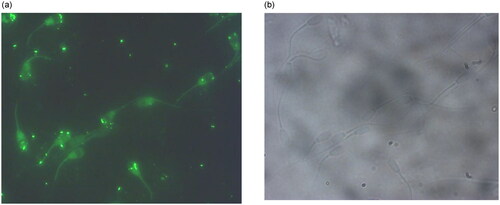
Figure 4. A Schematic representation of (a) binding of selected aptamer to sperm cells through interaction with sperm surface proteins and (b) magnetic separation of aptamer treated sperm cells bound and unbound fractions after aptamer treatment.
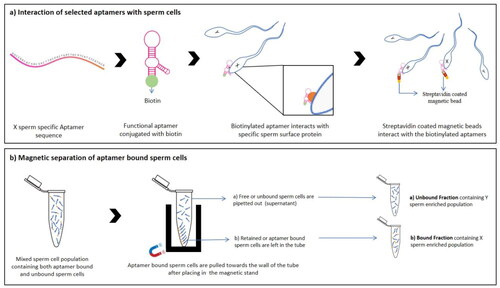
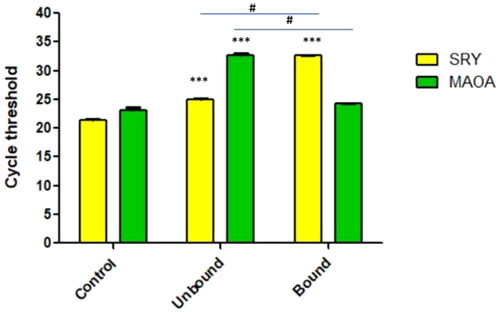
Figure 5. Real-time PCR analysis for determining the level of enrichment after treatment with X sperm specific aptamer 29a. # the difference between the two groups were significant at p < 0.05 and *** difference w.r.t control group were significant at p < 0.05.