Figures & data
Table 1. Basic information on Hsp70 family members in Penaeus chinensis.
Figure 1. Phylogenetic tree of 123 HSP70 proteins from seven species. The different colors of the dots represent different species. The varying colors in the outer ring region denote the six HSP70 categories (Hsc70l, Hspa5, Hspa9, Hspa14, Hyou1, and Hsph1) to which the 25 PcHSP70 members are classified.
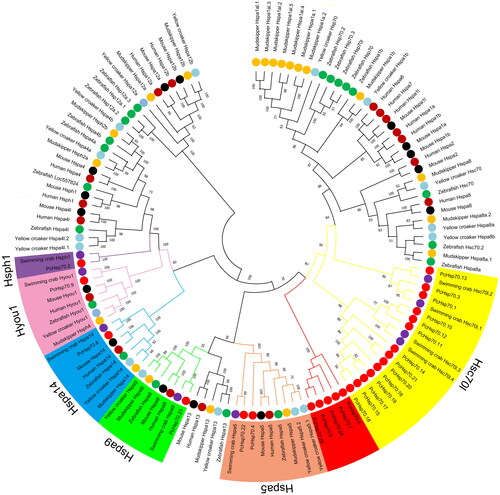
Figure 2. Schematic diagram of conserved motif (a), CDD domains (b), and gene structure (c) of PcHsp70s. For (a), the rectangles of different colors represent conservative base sequences. For (b), the colored bars signify conservative structural domains. For (c), green denotes 5’ and 3’ UTR regions; yellow signifies exons; black lines correspond to introns.
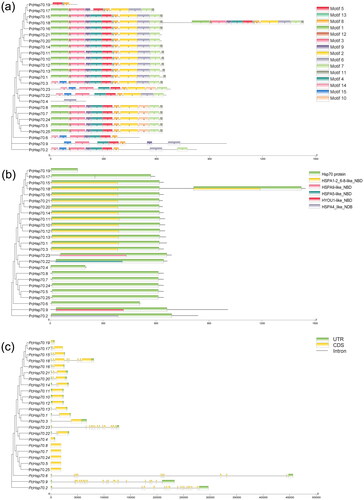
Figure 3. Localization and tandem duplications of the PcHsp70 gene on chromosomes. Orange denotes chromosome or scaffold numbers, red represent the PcHsp70 genes, and red short lines connect between tandem duplication gene pairs.
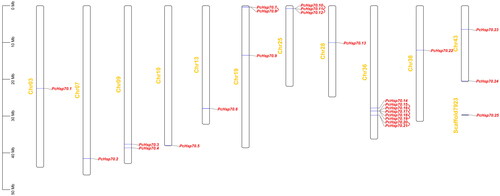
Figure 4. Collinearity analysis of Hsp70 genes between Penaeus chinensis and Portunus trituberculatus. Chromosomes of Penaeus chinensis are depicted in orange, while those of Portunus trituberculatus are shown in green. The solitary pair of HSP70 homologous genes is linked by a red line.
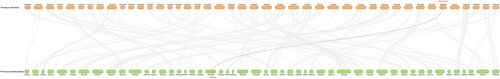
Table 2. Ka/Ks Values and divergence date of Hsp70 duplicated genes in Penaeus chinensis and between Penaeus chinensis and Portunus trituberculatus.
Figure 5. The GO enrichment analysis of PcHsp70 genes in Penaeus chinensis. Here, BP, CC, and MF are acronyms denoting biological processes, cellular components, and molecular functions, respectively. The color of the circles represents the magnitude of the p-value, with green indicating a larger value and red signifying a smaller value. The size of the circle is directly proportional to the enrichment count.
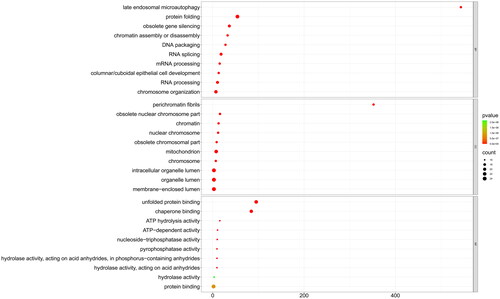
Figure 6. The KEGG pathway enrichment analysis of PcHsp70 genes in Penaeus chinensis. The bar frames represent the count quantity enriched on the pathway, while the color signifies the magnitude of the p-value. Blue indicates a larger value, whereas red suggests a smaller value.
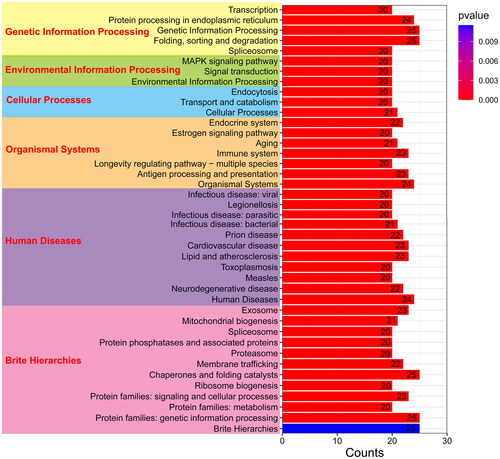
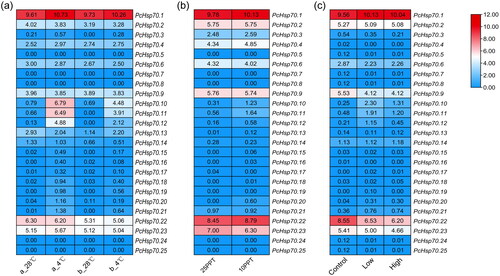
Figure 7. The expression pattern of PcHsp70 genes under low-temperature (a), low-saline (b), and WSSV-infected (c) treatments. For the low-temperature treatment, ‘a_28 °C’ represents breeding post-larval samples subjected to a normal temperature treatment (28 °C), while ‘a_4 °C’ symbolizes breeding post-larval samples exposed to a low-temperature treatment (4 °C). ‘b_28 °C’ signifies wild post-larval samples under normal temperature conditions (28 °C), and ‘b_4 °C’ pertains to wild post-larval samples under low-temperature conditions (4 °C). For the low-saline treatment, ‘25 PPT’ denotes a salinity concentration of 25 parts per thousand and ‘10 PPT’ signifies a salinity concentration of 10 parts per thousand. In the context of the WSSV-infected treatment, ‘control’ represents the healthy group, ‘low’ corresponds to the low WSSV load group (3.04 × 10⁻⁴ ±1.20 × 10⁻⁴), and ‘high’ stands for the high WSSV load group (4.32 × 10⁻¹±1.62 × 10⁻²). Color coding indicates expression levels, with red denoting high expression and blue representing low expression. The numerical values signify the normalized expression quantities.