Figures & data
Table 1. The tools for analysis and the content of their analysis are listed in the table.
Table 2. Information of primers.
Figure 1. Cloning and sequence analysis of NENF. (a) Amplification of NENF gene in Jianzhou Big-eared goat; DNA marker DL2000, NENF target skip. (b) The sequences of nucleotide and deduced amino acid of NENF cDNA in Jianzhou Big-eared goat. The two green arrows indicated the positions of primer pair. The start codon ATG and stop codon TGA are represented by red bases, respectively. (c) The composition of deduced amino acid for NENF protein in Jianzhou Big-eared goat. (d) Nucleotide sequence identity of NENF cDNA between Jianzhou Big-eared goats and other mammalian species.
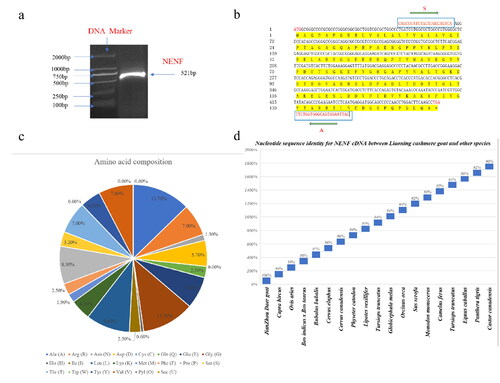
Figure 2. Structural analysis of NENF protein in goat. (a) Secondary structure prediction of NENF protein, α-helix are represented in blue, extended strand was represented in red, β-turn are represented in green, random coils are represented in orange. (b) Prediction of tertiary structure of NENF protein. (c) NENF protein interaction network.
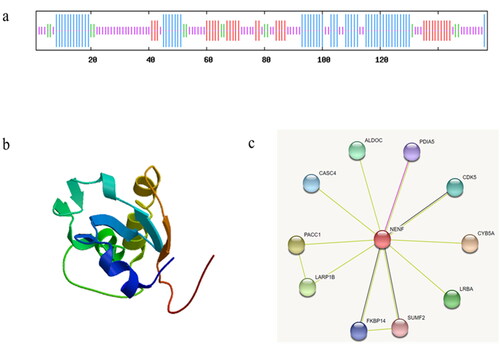
Figure 3. Relative expression level of NENF in goat tissues and subcutanesous adipocytes and intramuscular adipocytes. (a) Relative expression of NENF during differentiation of intramuscular adipocytes. (b) Relative expression of NENF during differentiation of subcutaneous adipocytes. *significant difference. (c) Relative expression level of NENF in different tissues in goat. ‘A’ means extremely significant difference, ‘B’ means significant difference.
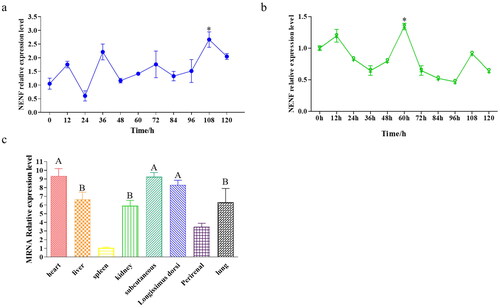
Figure 4. NENF overexpression promotes intramuscular adipocytes differentiation. (a) Quantitative polymerase chain reaction (qPCR) detects the overexpression efficiency of NENF in goat intramuscular adipocytes. (b) Oil red O staining of goat adipocytes. (c) Quantitative analysis of oil red O staining signal was indicated by absorbance at 492 nm. (d) Effect of overexpression of NENF on gene related to adipocytes differentiation of goat, expression changes in AP2, CEBPα, CEBPβ, SREBP-1, PREF-1, and PPARγ in intramuscular adipocytes. (e) Effects of NENF overexpression on genes associated with lipid synthesis in goat adipocytes. Changes in the expression of ADRP, ATGL, DGAT1, GPAM, ACC, and LPL in intramuscular adipocytes. *means P < 0.05, significant difference. **means P < 0.01, extremely significant difference.
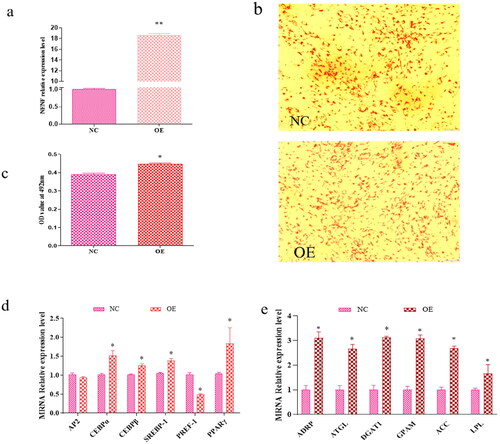
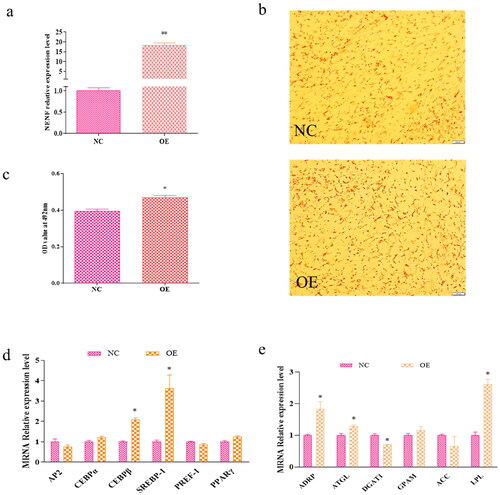
Figure 5. NENF overexpression promotes subcutaneous adipocytes differentiation. (a) qPCR detects the overexpression efficiency of NENF in goat subcutaneous adipocytes. (b) Oil red O staining of goat adipocytes. (c) Quantitative analysis of oil red O staining signal was indicated by absorbance at 492 nm. (d) Effect of overexpression of NENF on gene related to adipocytes differentiation of goat, expression changes in AP2, CEBPα, CEBPβ, SREBP-1, PREF-1, and PPARγ in subcutaneous adipocytes. (e) Effects of NENF overexpression on genes associated with lipid synthesis in goat adipocytes. Changes in the expression of ADRP, ATGL, DGAT1, GPAM, ACC, and LPL in subcutaneous adipocytes. *means P < 0.05, significant difference. **means P < 0.01, extremely significant difference.