
Figures & data
Figure 1. Number of SNPs on autosomes before and after quality control.
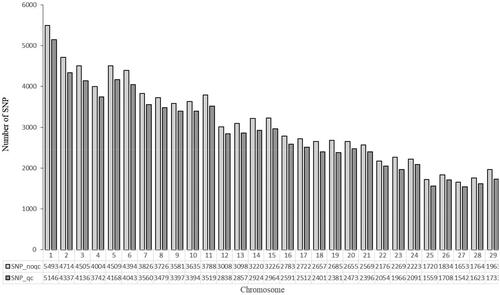
Table 1. Statistical results of SNP quality control.
Figure 2. Genetic diversity of Dengchuan cattle. (a) Proportion of minimum allele frequency. (b) Proportion of polymorphic information content. (c) Graph of heterozygosity analysis.
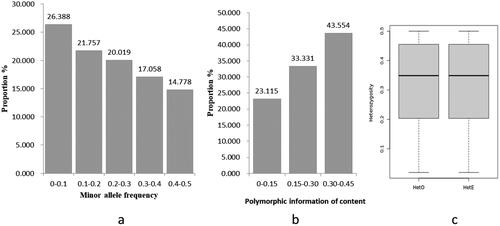
Table 2. Results of population genetic diversity analysis.
Figure 3. Visualization results of the IBS distance matrix. This figure represents the genetic distance between two individuals. The closer the colour shifts toward green, the closer the genetic relationship between two individuals. The horizontal and vertical coordinates represent individual identity documents.
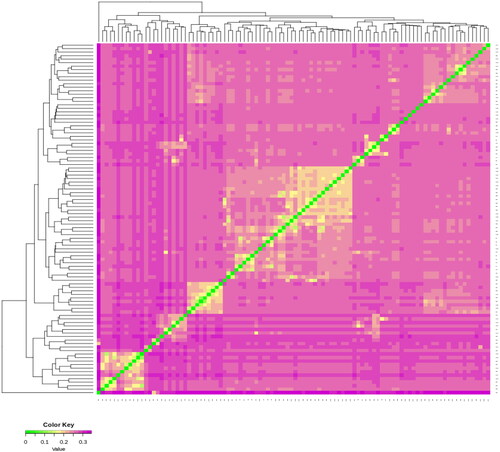
Figure 4. Visualization results of the G-matrix. This figure represents the kinship coefficient between two individuals. The closer the color is to purple, the closer the genetic relationship between two individuals.
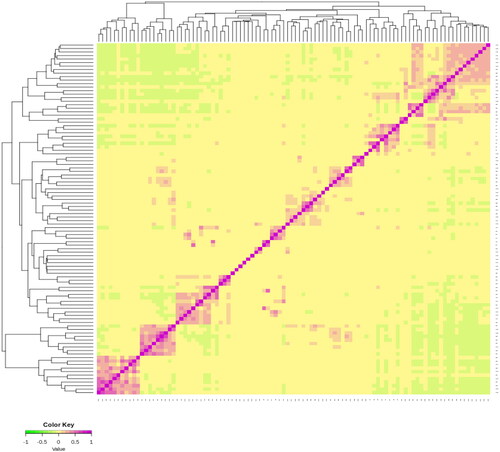
Figure 5. ROH analysis results. (a) Sample distribution of individual ROH lengths (the x-coordinate represents the length intervals of ROH, while the y-coordinate represents the number of individuals). (b) ROH length distribution across the population (the x-coordinate represents the length intervals of ROH, while the y-coordinate represents the population proportion). (c) distribution of ROH quantity on each chromosome (the x-coordinate represents the chromosome number, while the y-coordinate represents the ROH number). (d) distribution map of the inbreeding coefficient value (FROH) based on ROH (the white dots represent the median value of FROH within the Dengchuan cattle population. The upper and lower quartiles are represented by the upper and lower edges of the black box.).
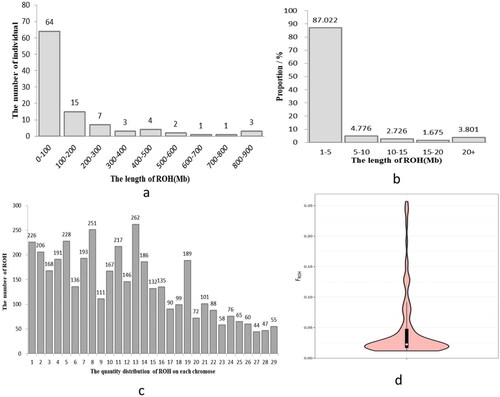
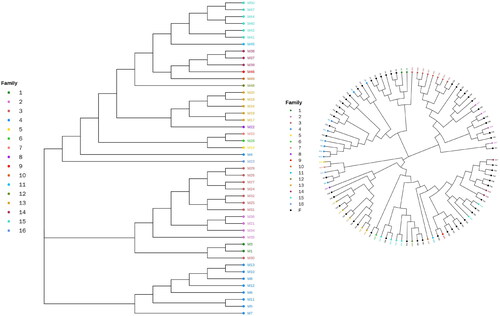
Figure 6. Cluster analysis results. (a) Cluster analysis results of male samples (each colour represents a family). (b) Cluster analysis results for all samples (bull samples are coloured in the evolutionary tree, with each colour representing a lineage).
Availability of data and materials
All data generated or analysed during this study are included in this published article.