
Figures & data
Figure 1. ASVs Aligning analysis. a: Venn map, b; annotation statistics.
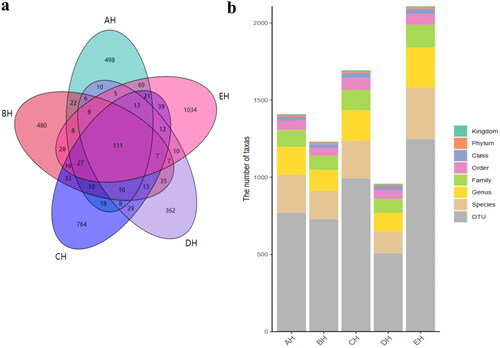
Figure 2. Comparing analysis of alpha diversity in SCT ruminants. a: chao1, b: faith_pd, c: observed_features, d: shannon_entropy, e: simpson.
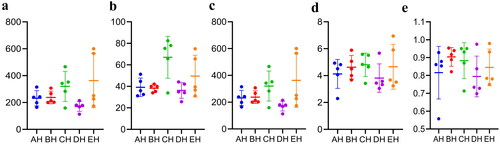
Table 1. The obtained sequencing data in SCT ruminants.
Table 2. Comparing analysis of alpha diversity index in SCT ruminants.
Figure 3. Fungi microbiota structure of SCT sheep at different taxa presented in percentile pile bar chart. a: Phylum, b: Class, c: Order, d: Family, e: Genera.
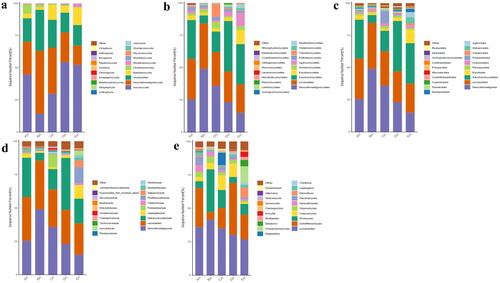
Figure 4. Comparing analysis of fungi microbiota structure of SCT sheep via grouping and clustering heat map. a: Phylum, b: Class, c: Order, d: Family, e: Genera.
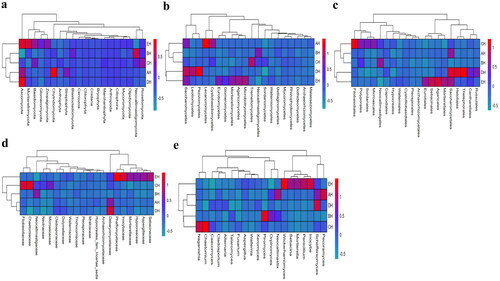
Figure 5. Evolutionary tree of species with heat map analysis of the fungi microbiota of SCT sheep in (a) class and (b) genera.
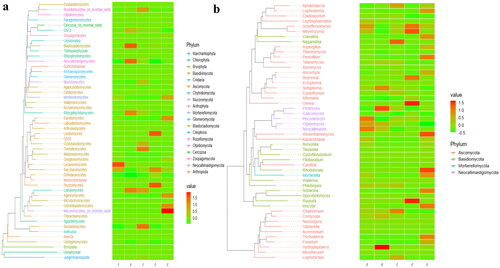
Figure 6. Beta diversity analysis of SCT sheep. a: NMDS, b: PCA, c: PCoA, d: Qiime2β, e: Group significance plots.
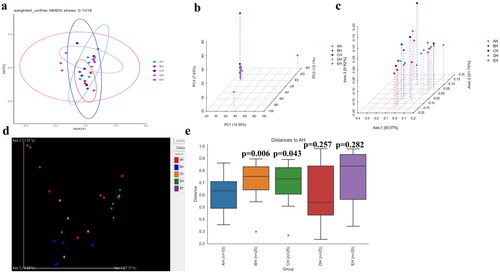
Figure 7. Exploring the significant different fungi species among SCT sheep via LEfSe. a: Phylum, b: Genera.
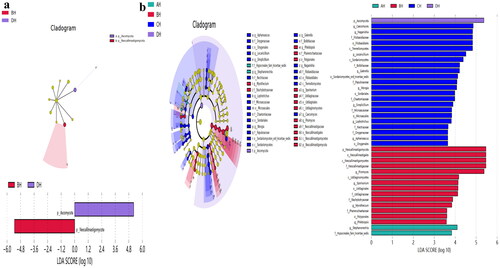
Figure 8. Discovering valid fungi species among SCT ruminants via DESeq2 volcano map a: Phylum, b: Genera.
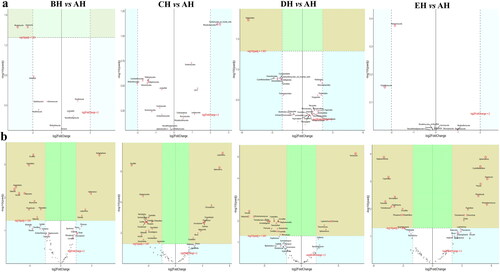
Figure 9. Network analysis of fungi microbiome of SCT sheep. a: Phylum, b: Genera.
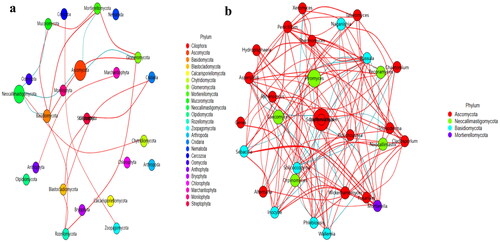
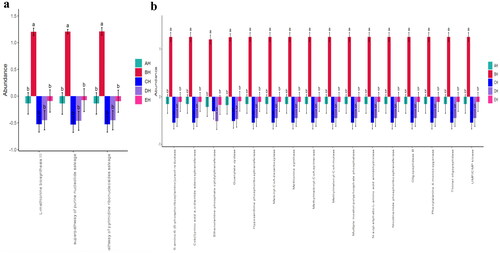
Figure 10. Comparing fungi microbiota function of metaCys pathways (a) and enzyme abundance (b) in SCT sheep.
Data availability
All raw sequences data were deposited in the NCBI Sequence Read Archive database under the following accession number: PRJNA1013103.