Figures & data
Figure 1. Pictures of normal teats in Hu sheep. Pictures of Hu sheep with two teats.
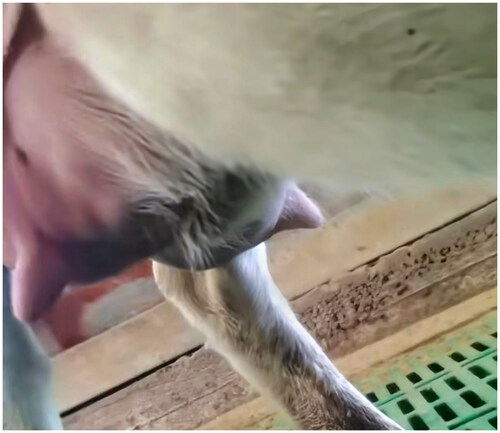
Figure 2. Pictures of Hu sheep with extra teats. (a) The picture shows a photograph of three teats of a lake sheep. (b) The picture shows the four teats of a Hu sheep.
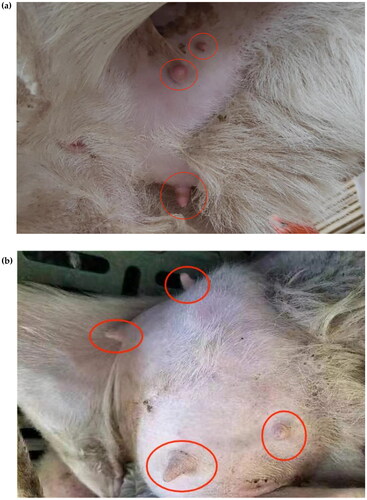
Figure 3. Manhattan plot of Fst analysis. The different colors in the figure represent the different chromosomes 1–27, and the thin red line in the figure represents the value of Fst = 0.115419, which is the value of the top 5% of the Fst analysis.
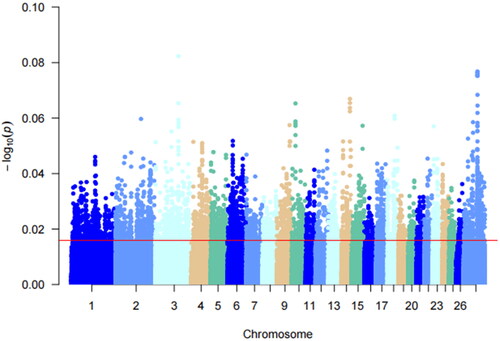
Figure 4. Manhattan plot of Pi analysis results. This figure shows the pi analyzed values for a multiple teats population of Hu sheep. Different colors in the figure represent different chromosomes and the thin red line represents the top 5% threshold line.
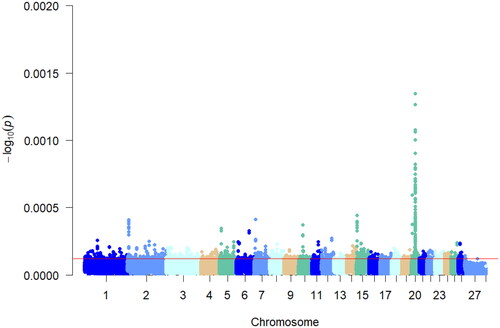
Figure 5. Manhattan plot of xpEHH analysis results. Different chromosomes are represented by different colors, red line in the figure represent candidate regions selected for xpEHH analysis.
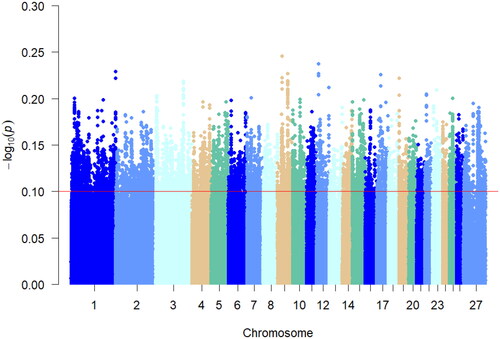
Figure 6. iHS Analysis of the manhattan diagram notes. The red line in the graph represents the top 5% threshold line.
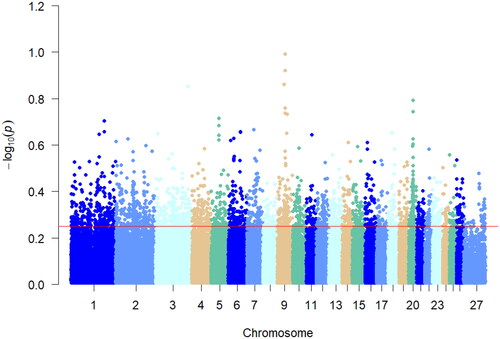
Table 1. Candidate gene correlation analysis values. The genes presented in the table are candidate genes common to the four selection signal analyses in the text.
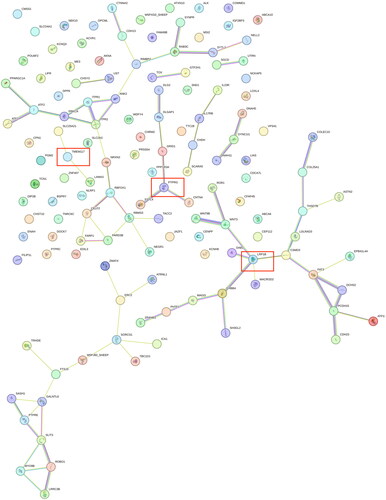
Figure 8. Related candidate genes protein interaction diagram. The genes identified by the red boxes in the figure are thought to be strongly correlated with the formation of the polydactyl trait in Hu sheep.