
Figures & data
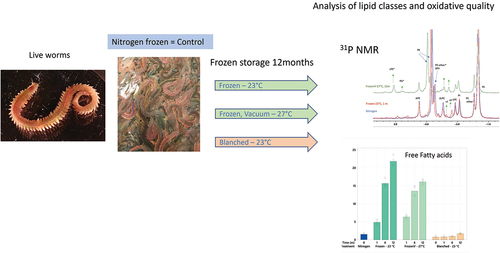
Table 1. Gross chemical composition of polychaete biomass submitted to different treatments. Dry matter is given as g/100 g, while ash and lipid content is given as g/100 g dry weight (dw) Significant differences (ANOVA p < .05) are given by different superscript letters.
Figure 1. Content of free fatty acid (weight % of crude lipids) in polychaete biomass during frozen storage up to 12 months at different conditions. ‘Nitrogen’ refers to live worms frozen with liquid nitrogen and extracted directly. ‘Frozen −23°C’ refers to worms frozen in plastic bags at − 23°C, while ‘FrozenV −27°C’ were vacuum packed prior to frozen storage at −27°C. ‘Blanched −23°C’ refers to blanched worms stored in plastic bags stored at −23°C. Results are reported as average- and individual values on four replicate extracts, and significant differences are denoted by different letters.
Figure 2. Content of total phospholipids from 31P NMR (weight % of total fatty acids) in polychaete biomass during frozen storage up to 12 months at different conditions. Results are reported as average- and individual values on four replicate extracts, and significant differences are denoted by different letters.
Figure 3. 31P NMR profile of lipids extracted from polychaete biomass at the beginning of the experiment (nitrogen frozen), compared with profiles after 1-month frozen storage at −23°C and after 12 months of frozen storage at −27°C in vacuum pack. Significant differences are denoted by different letters.
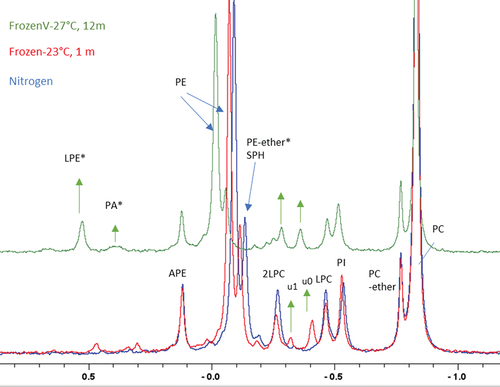
Figure 4. Scores (a) and loadings plot (b) from principal component analysis (PCA). The PCA illustrates changes in phospholipid composition in polychaete biomass during frozen storage at different conditions. Labels refer to sampling month. The first two principal components explained 63% and 13% of the variance in the dataset, respectively.
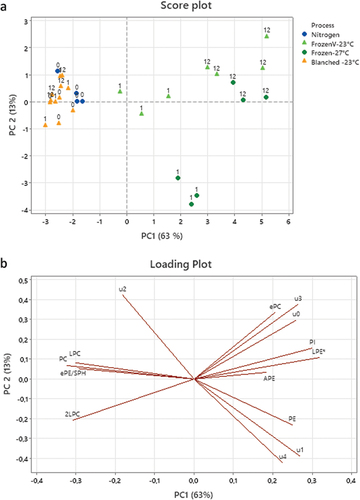
Table 2. Composition of phospholipids (mole % of total phospholipids) in polychaete biomass after different storage times for each phospholipid, values that do not share a letter are significantly different (ANOVA, p < .05).
Figure 5. Peroxide values (PV, reported as meq/kg oil) of lipids extracted from polychaete biomass during frozen storage at different conditions. Results are reported as average- and individual values on four replicate extracts. Significant differences are denoted by different letters.
Figure 6. Changes in TBARS values in (a) chloroform phase and (b) water/methanol phase of extracted polychaete biomass during storage at different conditions. Results are reported as average- and individual values on four replicate extracts. Significant differences are denoted by different letters.