Figures & data
Figure 1. 1000 L tub for onboard RSW trial.
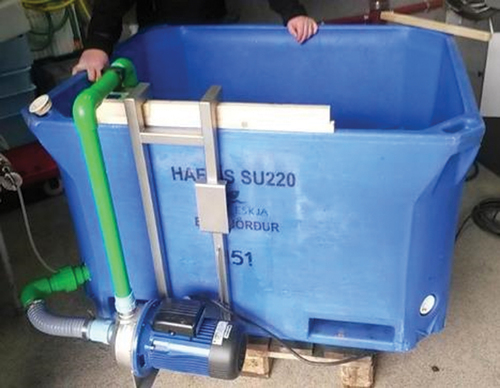
Figure 2. Bile spot on fillet belly flap marked in red circle on the figure (yellow discoloration).
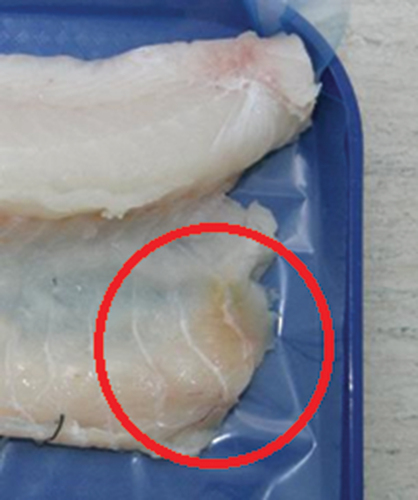
Figure 3. Temperature profiles of a fish loin (solid line) and the RSW cooling medium (dotted line) during the fishing trip.
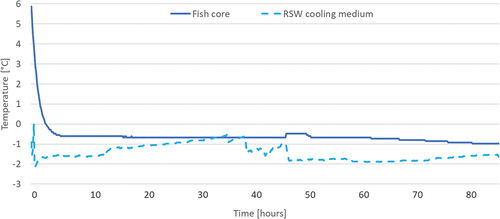
Table 1. Visual assessment defects in fillets after processing, 4 days after catch. Defects per fillet (n = 10 per group), mean ± SEM; NS = no significant difference between groups (p < 0.05); different superscript letters within each defect assessment denote a significant difference (p < 0.05) between the groups.
Figure 4. Development of microbial count for all groups on days 4, 7, and 11 from catch. DG-ICE: direct gutted, bled, iced in tub. GC-RSW24h: gill-cut, bled, and stored in RSW for 24 hours. GC-RSW60h: gill-cut, bled, and stored in RSW for 60 hours. GC-RSW84h: gill-cut, bled, and stored in RSW for 84 hours. Different superscript letters within each sampling day denote a significant count difference (p < 0.05) between the experimental groups.
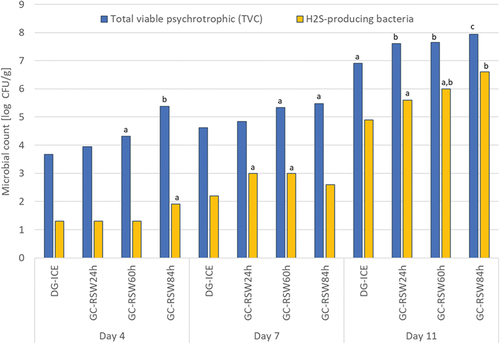
Figure 5. TVB-N measurements (mean ± SEM, n = 3) for all groups on days 4, 7, and 11 from catch. Different superscript letters within each sampling day denote a significant difference (p < 0.05) between the experimental groups.
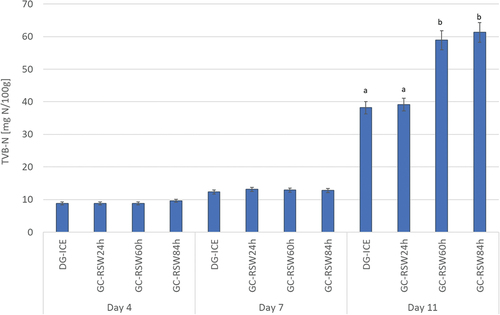
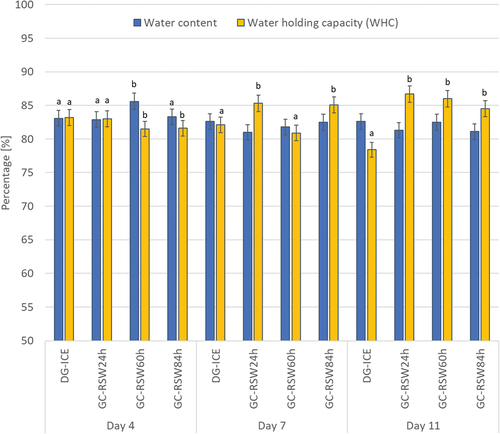
Figure 6. RSW experiment water and WHC (mean ± SEM, n = 3) for all groups on days 4, 7, and 11 from catch. Different superscript letters within each sampling day denote a significant difference (p < 0.05) between the experimental groups.