Figures & data
Table I. Descriptive statistics of the full sample (N = 3,256).
Table II. Statistically significant predictors of treatment outcome according to the original analyses of Edbrooke-Childs et al. (Citation2017).
Figure 1. GLMM tree for the unadjusted treatment outcome. Higher values represent poorer treatment outcomes. Panels depict subgroup sizes (N) and estimated fixed-effects means (M) with standard errors (SE). Note that SEs account for random variability between treatment centres, but not for the searching of the tree structure.
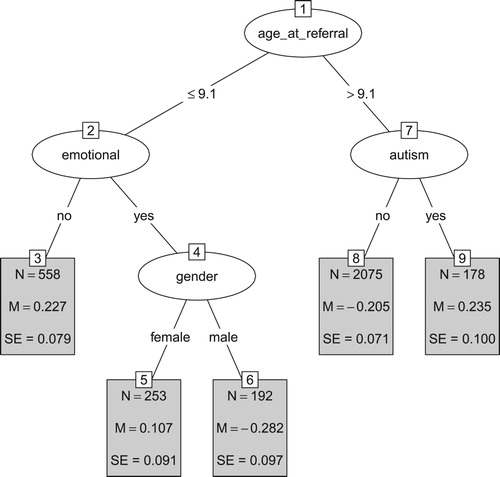
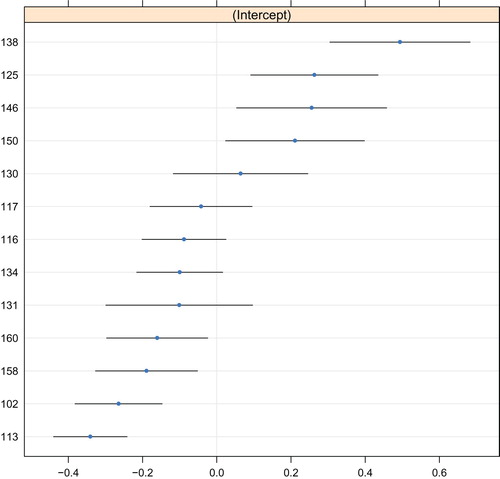
Figure 2. Random-effects predictions of the GLMM tree for the unadjusted treatment outcome. The y-axis represents indicators for service provider. The x-axis represents the predicted value of the random intercept, where higher values represent poorer treatment outcomes. Blue dots represent point predictions, black lines represent point predictions ±1.96 times the standard error. Note that these standard errors do not account for the searching of the tree structure.
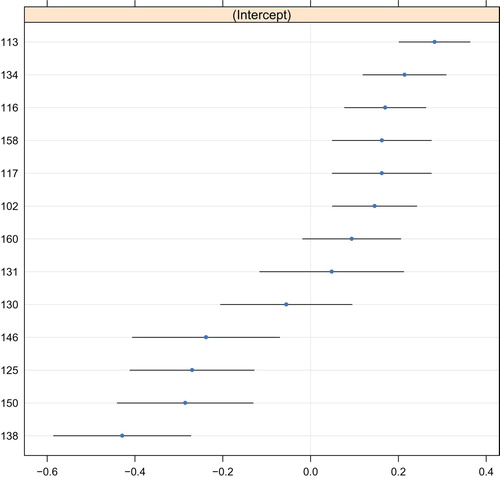
Figure 3. GLMM tree for the adjusted treatment outcome. Lower values reflect poorer treatment outcomes. Panels depict subgroups sizes (N), estimated fixed-effects means (M) and their respective standard errors (SE). Ethnicity was coded White (1), Mixed (2), Asian (3), Black or Black British (4), Other (5), Not reported or missing (6). Note that SEs account for random variability between treatment centres, but not for the searching of the tree structure.
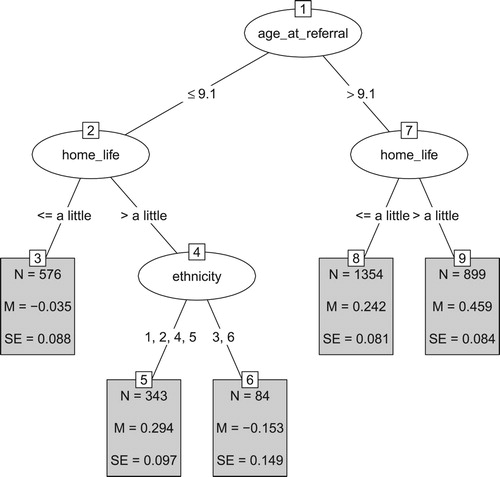
Figure 4. Random-effects predictions of the GLMM tree for the adjusted treatment outcome. The y-axis represents indicators for service provider. The x-axis represents the predicted value of the random intercept, where lower values represent poorer treatment outcomes. Blue dots represent point predictions, black lines represent point predictions ±1.96 times the standard error. Note that these standard errors do not account for the searching of the tree structure.