
Figures & data
Figure 1. Participant flow through the study. ACT = Acceptance and Commitment Therapy; CBT = Cognitive Behavioral Therapy.
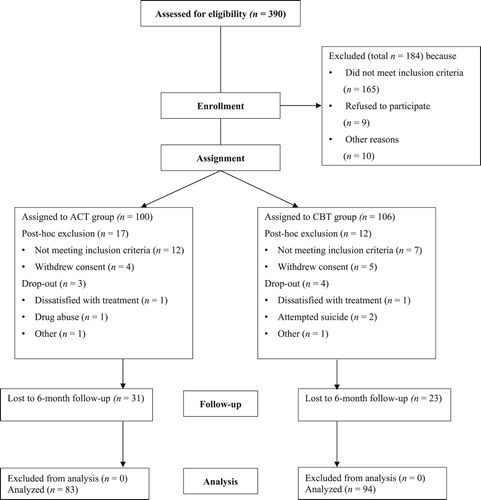
Table I. Sociodemographic and clinical characteristics for the Acceptance and Commitment Therapy (ACT) group and Cognitive Behavioral Therapy (CBT) group at baseline.
Table II. Treatment characteristics of the ITT sample divided by group.
Table III. Primary and secondary outcome scores of study-completers and dropouts at baseline.
Table IV. ITT pre-treatment, post-treatment and 6-months follow-up scores on primary and secondary outcome measures and within- and between-group effect sizes (Cohen’s d).
Table V. ITT percentage of patients who reliably remitted, reliably responded, reliably deteriorated and non-responded from pre- to post-treatment.
Table A1. Distribution of diagnoses referring to the SCID-I interview for the Acceptance and Commitment Therapy (ACT) group and Cognitive Behavior Therapy (CBT) group at baseline.
Data Availability Statement
The data that support the findings of this study are available from the corresponding author, MS, upon reasonable request.