Figures & data
Table I. Patient demographic and clinical characteristics as a function of treatment condition.
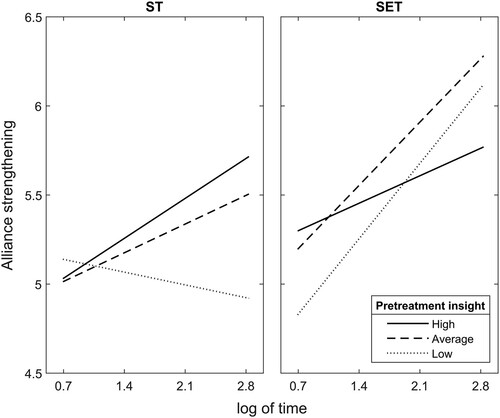
Figure 1. The 3-way interaction between pretreatment insight, treatment condition and time in predicting alliance strengthening. Note. The X axis refers to time operationalized as log of time according to the model. The Y axis refers to strengthening of the alliance (WAI) from one session to the next throughout treatment. The Solid line refers to patients with a high level (average+SD) of pretreatment insight (SUIP-I); the Dashed line refers to patients with an average level of pretreatment insight; and the Dotted line refers to patients with a low level (average–SD) of pretreatment insight. ST = supportive-treatment, SET = supportive-expressive treatment.