6,378
Views
0
CrossRef citations to date
0
Altmetric
EMPIRICAL PAPERS

Individual behavioral activation in the treatment of depression: A meta analysis

ORCID Icon, ORCID Icon, &
Pages 886-897 | Received 14 Feb 2023, Accepted 25 Mar 2023, Published online: 17 Apr 2023

Figures & data

Figure 1. PRISMA flow diagram.

Figure 1. PRISMA flow diagram.

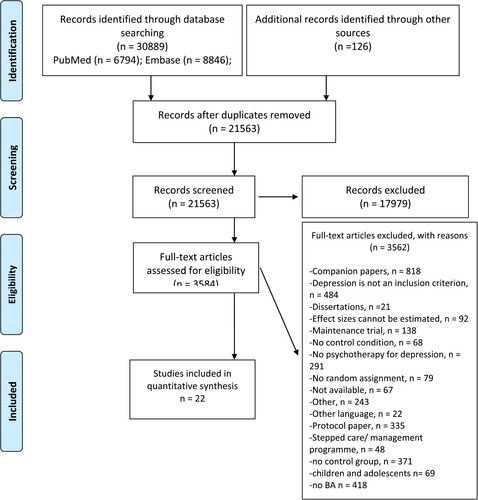
Table 1. Selected characteristics of randomised trials comparing individual behavioral activation to control groups.

Figure 2. Forest plot a) Abbreviations: bat: behavioral activation therapy; cau: care-as-usual; ctr: control; g: Hedges’ g; S.E.: standard error; vs: versus; wl: waiting list.

Figure 2. Forest plot a) Abbreviations: bat: behavioral activation therapy; cau: care-as-usual; ctr: control; g: Hedges’ g; S.E.: standard error; vs: versus; wl: waiting list.

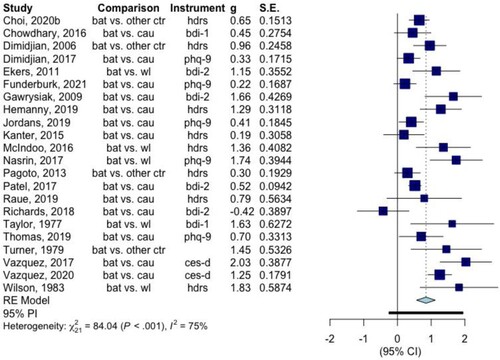
Table 2. The effects of individual Behavioral activation for depression according to different models.

Table 3. Subgroup analyses.