
Figures & data
Table 1. Characteristics of patients
Table 2. Scales, abbreviations and internal consistency at each time-point.
Figure 1. Percentages of patients who missed a measure or went out of treatment. Note: Percentages of missing data at a time-point are based on the number of patients in treatment at each time-point (T), while the cumulative out of treatment patients were based on the number of patients included in the study. T1 = the measurement at the start of treatment, and T2 – T5 are recurring measurements every three months.
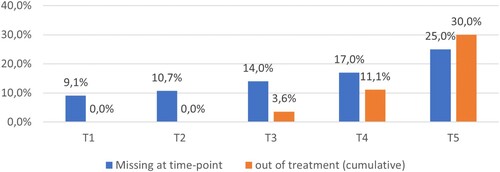
Table 3. Summary statistics of the mental health domains.
Table 4. Model fit indices of the mental health models.
Figure 2. Mental health networks. Note: The node descriptions can be found in .
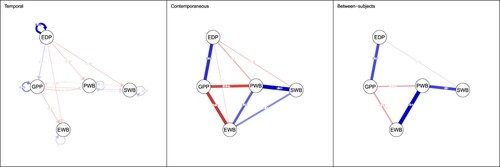
Table 5. Estimated partial correlations and centrality results of the final mental health networks.
Figure 3. Extended mental health networks. Note: The node descriptions can be found in .
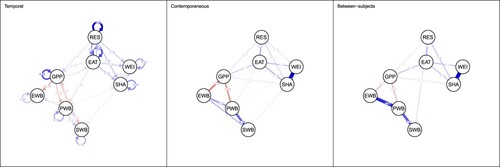
Table 6. Estimated partial correlations and centrality results of the final mental health networks.
Data Availability
The data that support the findings of this study are available on request from the corresponding author. The data are not publicly available due to restrictions e.g. their containing information that could compromise the privacy of research participants.