
Figures & data
Table I. Sample characteristics (after multiple imputation).
Table II. Treatment outcome in the total sample and matched Tf-CBT and EMDR groups.
Table III. Model prediction accuracy (R2) and error (RMSE) of the Tf-CBT and EMDR prediction models in the development and validation samples.
Figure 1. Calibration plot comparing predicted and observed post-treatment PHQ-9 scores.
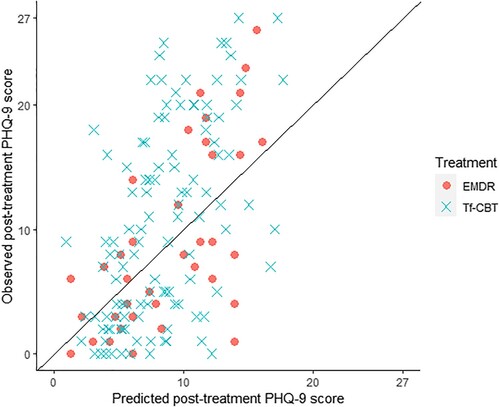
Table IV. Comparing the rate of reliable improvement in PHQ-9 score between cases who received their model-indicated optimal treatment (N = 87) and those who received their model-indicated suboptimal treatment (N = 65).
Table V. Predicting post-treatment PHQ-9 score (square root transformed) from having received model-indicated optimal treatment, adjusted for pre-treatment PHQ-9 score and propensity score estimate (log transformed), among patients with a PAI > 1.92 (N = 93).
tpsr-2024-0069-File003
Download MS Word (797.1 KB)Data Availability Statement
In line with the requirements of the ethics review board for this study, requests for access to data are to be made in writing to the data controller, Michael Barkham, [email protected].