Figures & data
Table 1. Assessment numbers (total for each REC-CAP assessment) from baseline assessment for HARP and SRR groups.
Table 2. Comparison between HARP and SRR groups at baseline (summary means for binary and numerical measures).
Table 3. Average treatment effect estimator of disengagement and retention length from recovery residences: HARP compared to SRR.
Figure 1. Generalized Estimated Equation (GEE) model with stabilized weights for changes in REC-CAP from baseline: HARP compared to SRR.
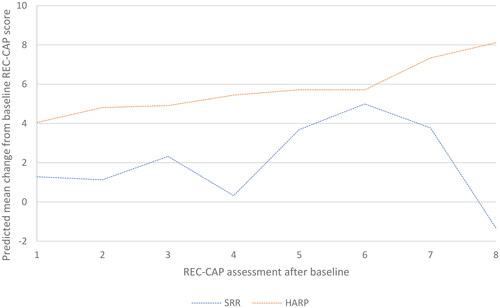
Figure 2. Generalized Estimated Equation (GEE) model with stabilized weights for changes in REC-CAP from baseline within the HARP program, comparing the Therapeutic Community and Community components.
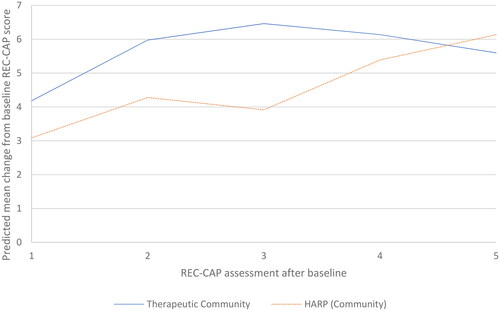
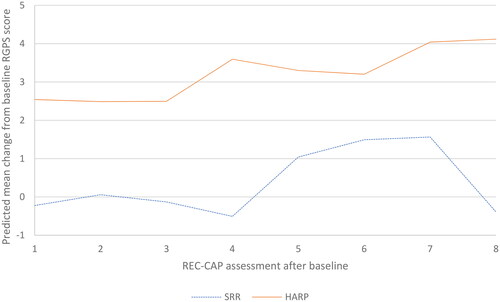
Figure 3. GEE model with stabilized weights for changes in RGPS from baseline: HARP compared to SRR.