Figures & data
Figure 1. The multimodal interface of a VA application. The words Where, What, Why, When with corresponding arrows have been added to the picture, they do not appear on the ordinary interface. (Image originator M. Jern, NVCA, Linköping University.).
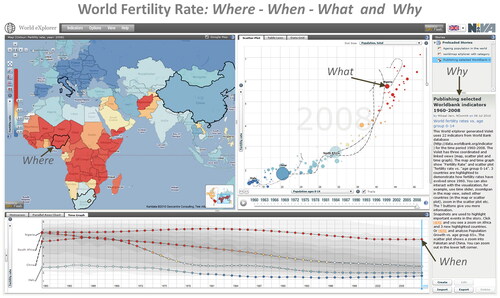
Figure 2. Visualisation components available for composing a Vislet (image originator M. Jern, NVCA, Linköping University).
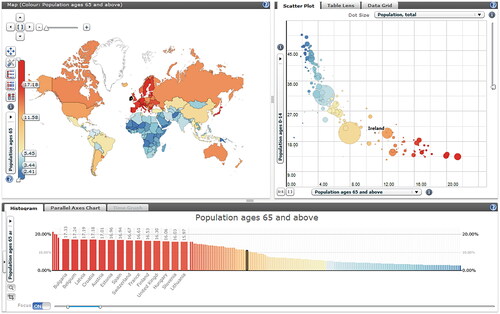
Figure 3. Example of an interactive educational document, a Vislet, based on public World Bank indicators with educational text, map, motion chart, snapshots, and time series—the methodological concept (image originator M. Jern, NVCA, Linköping University).
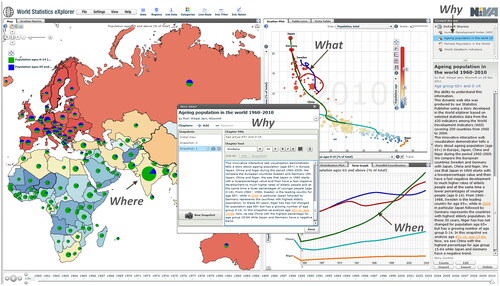
Figure 4. The interface, in which Ellie’s gaze focuses the information in the black and white text box that suddenly are displayed.
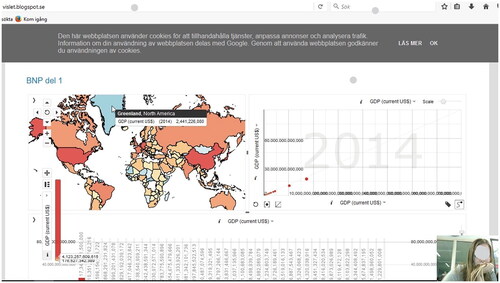
Figure 5. The interactive interface when Sweden is highlighted (bolded) in the bar chart for a very short moment.
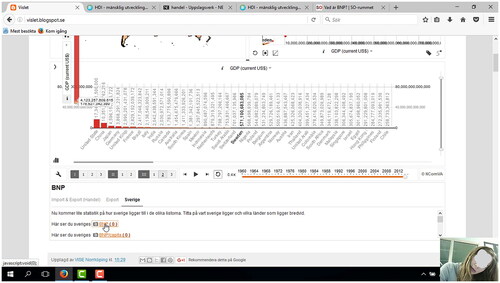
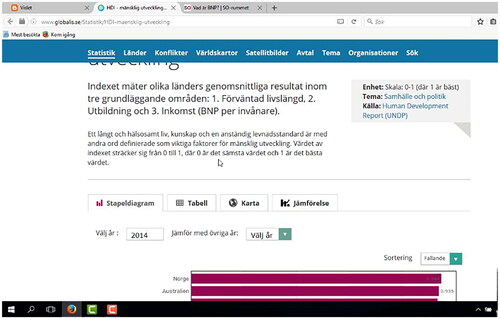
Figure 6. The interface with information about the concept of HDI. The written text explains the concept HDI, and the bar chart illustrates its value for different countries.
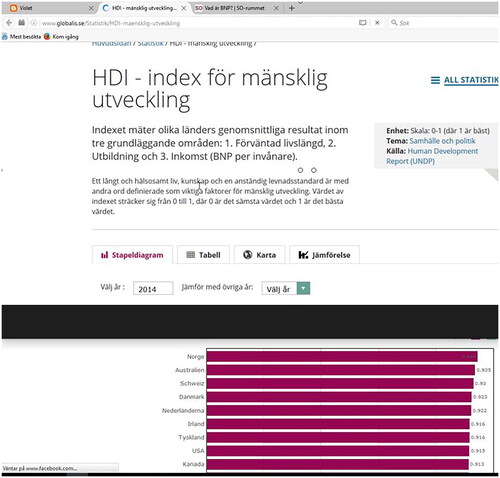
Figure 7. The interface when the map is zoomed in to far so that the entire map area turns red, and the map contours disappears.
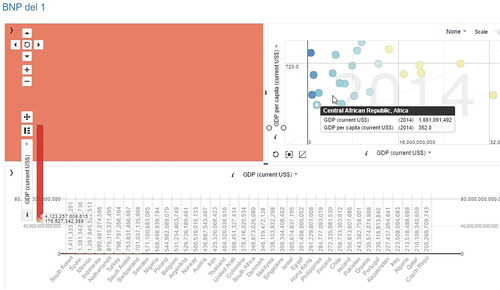
Figure 8. The interface where the bar, illustrating the USA, in the bar chart is tool tipped by the cursor and a black and white text box appears with written text information.
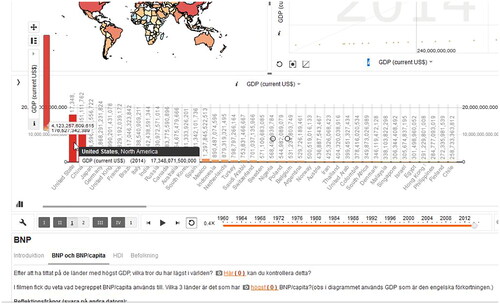
Figure 9. The interface that displays written text about HDI in the moment when the cursor’s arrow is placed next to the words following the last written line at the same time as Ellie reads the text out loud.