
Figures & data
Table 1. Baseline characteristics of the matched MTO study population.a
Figure 1. Inpatient hospitalizations and ED visits based on primary diagnosis among voucher groups versus control group.
Note. Mean hospitalizations and emergency department (ED) visits represent counts per 100 person-years and were estimated from intercept-only negative binomial regression models, with an offset term for the total months of available data for a person-year and survey sample weights to account for varying sample probabilities over the accrual period. Incidence rate ratios are expressed as the voucher groups relative to the control group and were derived from negative binomial regression models for the count of hospitalizations or ED visits with the person-year as the unit of observation and adjustments made for the set of covariates described in the text. The models included survey sample weights to account for varying sampling probabilities over the accrual period and accounted for the family unit by clustering all standard errors by family. The size of each square point is proportional to the number of person-years of data available. Diabetes, obesity, and hypertension are not included for children because of their low prevalence.
*Adjusted p values represent the lowest false discovery rate threshold at which the test could be considered significant, using the Benjamini–Hochberg procedure to keep the false discovery rate to less than 1 out of 8, corresponding to the number of comparisons per group of analyses for adults, and 1 out of 5, corresponding to the number of comparisons per group of analyses for children; an adjusted p value is statistically significant if < .125 for adults and if < .20 for children
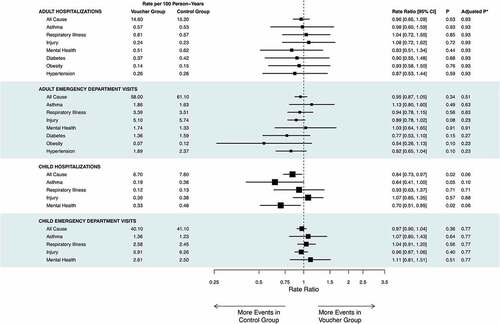
Figure 2. Type of service utilization among voucher groups versus control groups.
Note. Mean types of service utilization represent counts per 100 person-years and were estimated from intercept-only negative binomial regression models with an offset term for the total months of available data for a person-year and survey sample weights to account for varying sample probabilities over the accrual period. Incidence rate ratios are expressed as the voucher groups relative to the control group and were derived from negative binomial regression models, with an offset term indicating the total months of available data for the person and adjustments made for the set of covariates described in the text. The models included survey sample weights to account for varying sampling probabilities over the accrual period and accounted for the family unit by clustering all standard errors by family. The size of each square point is proportional to the number of person-years of data available.
*Adjusted p values represent the lowest false discovery rate threshold at which the test could be considered significant, using the Benjamini–Hochberg procedure to control the false discovery rate to less than 1 of 11, corresponding to the number of comparisons per group of analyses; an adjusted p value is statistically significant if <.09
Table 2. Housing/neighborhood-sensitive hospitalizations and emergency department (ED) visits based on all diagnostic codes among voucher groups vs. control groupa: adults and children
Table 3. Inpatient hospitalizations and emergency department (ED) visits based on primary diagnosis: magnitudes are shown as associations with a 10-percentage-point decrease in neighborhood poverty
Table 4. Magnitudes of the association with types of service as a 10-percentage-point decrease in neighborhood poverty+