
Figures & data
Figure 1. Distribution of survey respondents and overall population living in cars and vans compared to recreational vehicles (RVs) and campers.
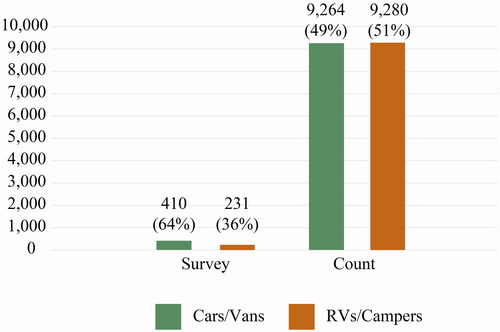
Table 1. Characteristics of total, nonvehicular unhoused, and vehicular unhoused individuals.
Figure 2. Graphic representation of logit model results.
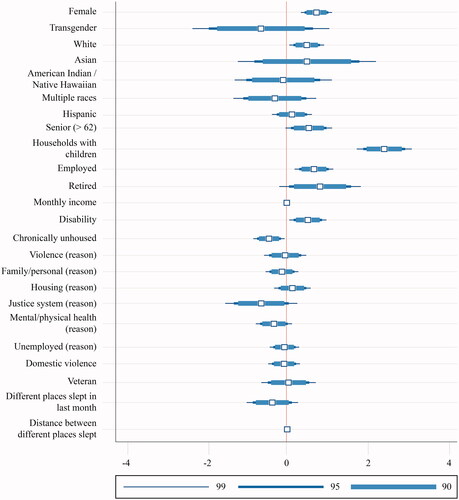
Table 2. Logit model results—likelihood of living in a vehicle.
Table A1. Characteristics of total vehicular respondents, vehicular respondents living on public streets, and vehicular respondents living in SPPs.
